
Compare Cholaman.Inv.&Fn with Similar Stocks
Dashboard
Strong Long Term Fundamental Strength with an average Return on Equity (ROE) of 17.90%
- Healthy long term growth as Operating profit has grown by an annual rate of 26.38%
Positive results in Mar 26
With ROE of 17.2, it has a Expensive valuation with a 4.7 Price to Book Value
High Institutional Holdings at 44.79%
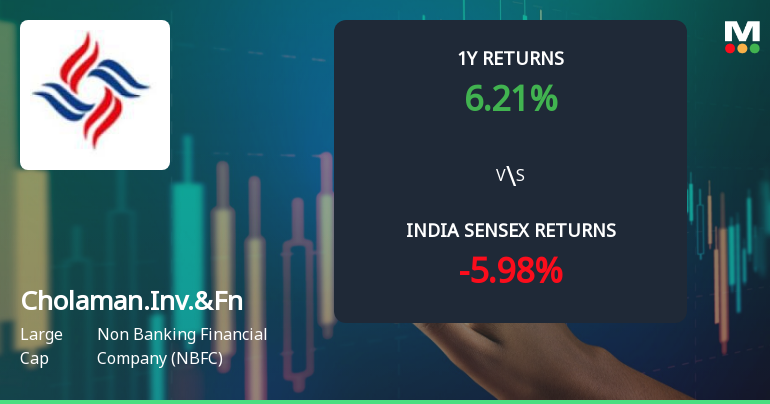
Market Beating performance in long term as well as near term
Stock DNA
Non Banking Financial Company (NBFC)
INR 144,454 Cr (Large Cap)
28.00
21
0.12%
6.93
17.18%
4.73
Total Returns (Price + Dividend) 
Latest dividend: 1.2979648044530776 per share ex-dividend date: Feb-05-2026
Risk Adjusted Returns v/s
Returns Beta

News
Cholamandalam Investment & Finance Company Ltd: Technical Momentum Shifts Signal Cautious Outlook
Cholamandalam Investment & Finance Company Ltd has experienced a notable shift in price momentum, reflected in a complex interplay of technical indicators. While the stock’s recent surge of 5.54% in a single day signals renewed investor interest, the broader technical landscape reveals a nuanced picture with mixed signals from MACD, RSI, moving averages, and other momentum oscillators.
Read full news article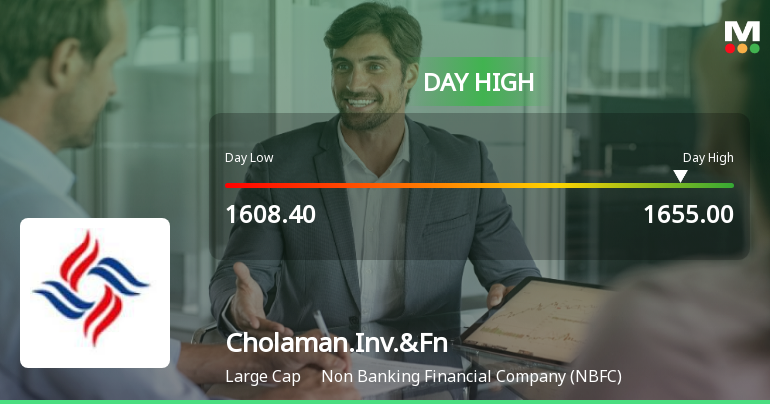
Cholamandalam Investment & Finance Company Ltd Surges 5.3% to Day's High of Rs 1655 — Outperforms Sector by 3.16 Percentage Points
The Sensex advanced 1.39% on 15 Jun 2026, yet Cholamandalam Investment & Finance Company Ltd outpaced the broader market with a 5.3% gain, reaching an intraday high of Rs 1655. This 3.16 percentage-point outperformance over the NBFC sector’s 2.14% rise highlights a distinctly stock-specific rally rather than a mere market tailwind.
Read full news article
Announcements
Announcement under Regulation 30 (LODR)-Allotment
18-Jun-2026 | Source : BSECompany confirms allotment of 10000 units of secured redeemable listed NCDs on 18th June 2026.
Announcement under Regulation 30 (LODR)-Allotment of ESOP / ESPS
17-Jun-2026 | Source : BSEEnclosed Intimation on allotment of equity shares on exercise of ESOPs.
Announcement under Regulation 30 (LODR)-Allotment of ESOP / ESPS
08-Jun-2026 | Source : BSEIntimation on allotment of 47410 equity shares on exercise of ESOP.
Corporate Actions

No Upcoming Board Meetings

Cholamandalam Investment & Finance Company Ltd has declared 35% dividend, ex-date: 21 Jul 26

Cholamandalam Investment & Finance Company Ltd has announced 2:10 stock split, ex-date: 14 Jun 19

No Bonus history available

Cholamandalam Investment & Finance Company Ltd has announced 3:8 rights issue, ex-date: 11 Sep 07
Quality key factors
Valuation key factors
Technicals key factors
 Technical Indicator Scale: Bearish, Mildly Bearish, Sideways, Mildly Bullish, Bullish Turned
 Shareholding Snapshot : Mar 2026
Shareholding Compare (%holding)
Promoters
None
Held by 41 Schemes (14.98%)
Held by 778 FIIs (24.87%)
Cholamandalam Financial Holdings Limited (43.76%)
Nps Trust A/c - Sbi Pension Funds Pvt. Ltd. - Nps (2.71%)
4.59%
Quarterly Results Snapshot (Consolidated) - Mar'26 - QoQ

QoQ Growth in quarter ended Mar 2026 is 6.56% vs 5.43% in Dec 2025
QoQ Growth in quarter ended Mar 2026 is 27.54% vs 11.24% in Dec 2025
Half Yearly Results Snapshot (Consolidated) - Sep'25

Growth in half year ended Sep 2025 is 22.30% vs 38.63% in Sep 2024
Growth in half year ended Sep 2025 is 19.97% vs 29.14% in Sep 2024
Nine Monthly Results Snapshot (Consolidated) - Dec'25
YoY Growth in nine months ended Dec 2025 is 20.51% vs 37.11% in Dec 2024
YoY Growth in nine months ended Dec 2025 is 19.45% vs 27.53% in Dec 2024
Annual Results Snapshot (Consolidated) - Mar'26
YoY Growth in year ended Mar 2026 is 20.22% vs 35.04% in Mar 2025
YoY Growth in year ended Mar 2026 is 22.75% vs 24.64% in Mar 2025
About Cholamandalam Investment & Finance Company Ltd

Company Coordinates


