
Compare ISL Consulting with Similar Stocks
Stock DNA
Non Banking Financial Company (NBFC)
INR 47 Cr (Micro Cap)
NA (Loss Making)
22
0.00%
0.00
-18.69%
4.29
Total Returns (Price + Dividend) 
ISL Consulting for the last several years.
Risk Adjusted Returns v/s
Returns Beta

News
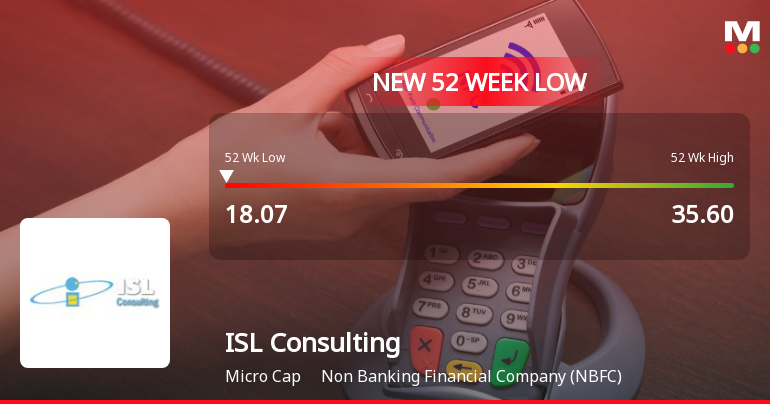
ISL Consulting Ltd Falls to 52-Week Low of Rs 18.07 as Sell-Off Deepens
For the second consecutive session, ISL Consulting Ltd has seen its share price decline sharply, hitting a fresh 52-week low of Rs 18.07 on 6 Jul 2026. This latest drop extends the stock’s year-long underperformance, with returns down 32.75% compared to the Sensex’s modest 6.32% decline over the same period.
Read full news article
ISL Consulting Ltd is Rated Strong Sell
ISL Consulting Ltd is rated Strong Sell by MarketsMOJO, with this rating last updated on 04 May 2026. However, the analysis and financial metrics discussed here reflect the company’s current position as of 29 June 2026, providing investors with the latest insights into the stock’s performance and outlook.
Read full news article
ISL Consulting Ltd is Rated Strong Sell
ISL Consulting Ltd is rated Strong Sell by MarketsMOJO, with this rating last updated on 04 May 2026. However, the analysis and financial metrics discussed here reflect the company’s current position as of 18 June 2026, providing investors with the latest insights into the stock’s performance and outlook.
Read full news article Announcements
Closure of Trading Window
26-Jun-2026 | Source : BSEThis is to inform you that pursuant to SEBI (Prohibition of Insider Trading) Regulations 2015 as amended from time to time as per BSE Circular LIST/COMP/01/2019-20 dated April 2 2019 and in accordance with the code of conduct for prevention of Insider Trading the Trading Window shall remain closed from Wednesday July 1 2026 till the end of 48 hours after the declaration of Un-Audited Financial Results for the quarter ended on 30th June 2026
Announcement under Regulation 30 (LODR)-Newspaper Publication
03-Jun-2026 | Source : BSEPursuant to Regulation 30 of the Securities and Exchange Board of India (Listing Obligations and Disclosure Requirements) Regulations 2015 we enclose herewith copy of the newspapers advertisement published today i.e. on June 03 2026 intimating the Members about the opening of a Special Window for Re-lodgment of Transfer Requests of Physical Shares in accordance with SEBI Circular No. HO/38/13/11(2)2026-MIRSD-POD/I/3750/2026 dated January 30 2026 the shareholders of ISL Consulting Limited are hereby informed that a Special Window has been opened for a period of one year from February 5 2026 to February 4 2027 for transfer and dematerialization (demat) of physical securities which were sold/purchased prior to April 01 2019
Announcement under Regulation 30 (LODR)-Newspaper Publication
01-Jun-2026 | Source : BSEPlease find enclosed herewith Copy of Advertisement of Standalone Audited Financial Results for the Quarter and Year ended on March 31 2026 as per Regulation 47(1) (b) 47(3) and 47 (4) of the SEBI (Listing Obligations and Disclosure Requirements) Regulations 2015 published in one English daily newspaper and one daily newspaper in the language of the region as on May 30 2026 where the registered office of the company is situated.
Corporate Actions

No Upcoming Board Meetings

No Dividend history available

ISL Consulting Ltd has announced 5:10 stock split, ex-date: 08 Mar 19

No Bonus history available

No Rights history available
Quality key factors
Valuation key factors
Technicals key factors
 Technical Indicator Scale: Bearish, Mildly Bearish, Sideways, Mildly Bullish, Bullish Turned
 Shareholding Snapshot : Mar 2026
Shareholding Compare (%holding)
Promoters
None
Held by 0 Schemes
Held by 0 FIIs
Reem Broking Private Limited (16.8%)
Jamie Properties Private Limited (4.98%)
31.98%
Quarterly Results Snapshot (Standalone) - Mar'26 - QoQ

QoQ Growth in quarter ended Mar 2026 is -20.04% vs -5.32% in Dec 2025
QoQ Growth in quarter ended Mar 2026 is -1,666.67% vs 127.69% in Dec 2025
Half Yearly Results Snapshot (Standalone) - Sep'25
Growth in half year ended Sep 2025 is -31.79% vs 179.19% in Sep 2024
Growth in half year ended Sep 2025 is -63.86% vs -39.42% in Sep 2024
Nine Monthly Results Snapshot (Standalone) - Dec'25
YoY Growth in nine months ended Dec 2025 is -17.66% vs 71.40% in Dec 2024

YoY Growth in nine months ended Dec 2025 is 809.09% vs -102.41% in Dec 2024
Annual Results Snapshot (Standalone) - Mar'26
YoY Growth in year ended Mar 2026 is -24.07% vs 1.07% in Mar 2025
YoY Growth in year ended Mar 2026 is -18.50% vs -155.81% in Mar 2025
About ISL Consulting Ltd

Company Coordinates


