
Compare Ambalal Sarabhai with Similar Stocks
Dashboard
Poor Management Efficiency with a low ROCE of 6.22%
- The company has been able to generate a Return on Capital Employed (avg) of 6.22% signifying low profitability per unit of total capital (equity and debt)
Positive results in Mar 26
With ROCE of 4, it has a Very Attractive valuation with a 1.4 Enterprise value to Capital Employed
Majority shareholders : Non Institution
Underperformed the market in the last 1 year
Stock DNA
Pharmaceuticals & Biotechnology
INR 247 Cr (Micro Cap)
13.00
34
0.00%
0.23
11.67%
1.55
Total Returns (Price + Dividend) 
Ambalal Sarabhai for the last several years.
Risk Adjusted Returns v/s
Returns Beta

News
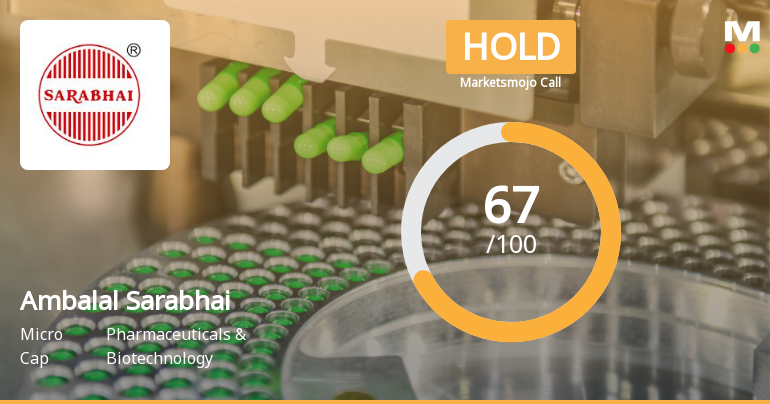
Ambalal Sarabhai Enterprises Ltd Downgraded to Hold Amid Mixed Technical and Financial Signals
Ambalal Sarabhai Enterprises Ltd, a micro-cap player in the Pharmaceuticals & Biotechnology sector, has seen its investment rating downgraded from Buy to Hold as of 8 June 2026. This adjustment reflects a nuanced reassessment across four key parameters: quality, valuation, financial trend, and technical indicators. Despite positive quarterly financial results, evolving technical signals and valuation considerations have tempered investor enthusiasm, prompting a more cautious stance.
Read full news article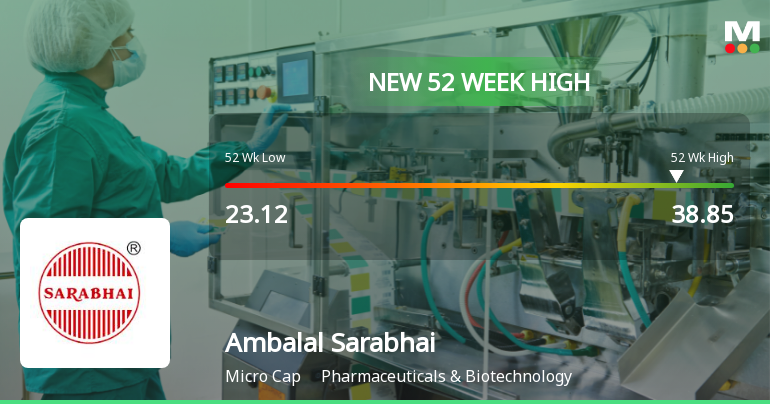
Broad-Based Technical Strength Lifts Ambalal Sarabhai Enterprises Ltd to 52-Week High of Rs 38.85
With a decisive surge to Rs 38.85 on 2 Jun 2026, Ambalal Sarabhai Enterprises Ltd has reached a fresh 52-week high, marking a significant milestone in its price momentum. This rally stands out amid a broader market backdrop where the Sensex trades near its 52-week low, underscoring the stock’s relative strength and technical resilience.
Read full news article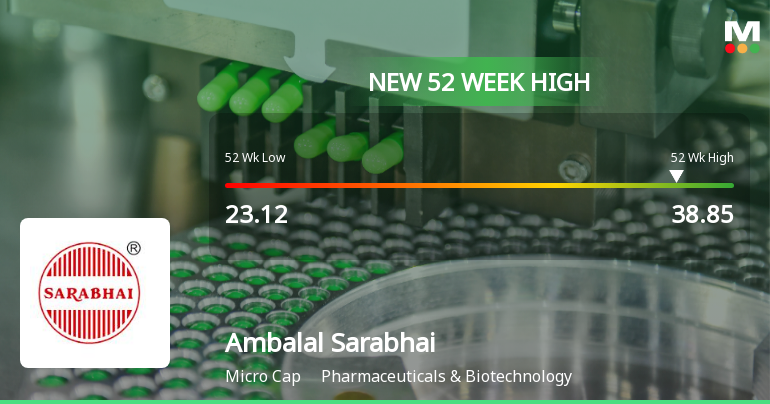
Broad-Based Technical Strength Lifts Ambalal Sarabhai Enterprises Ltd to 52-Week High of Rs 38.85
With a decisive intraday surge pushing Ambalal Sarabhai Enterprises Ltd to a fresh 52-week high of Rs 38.85 on 2 Jun 2026, the stock has demonstrated robust momentum amid a broader market backdrop that remains subdued.
Read full news article Announcements
Compliances-Reg.24(A)-Annual Secretarial Compliance
27-May-2026 | Source : BSEWe hereby submit Annual Secretarial Compliance Report for FY 2025-26. Kindly take the same on your records.
Announcement under Regulation 30 (LODR)-Newspaper Publication
24-May-2026 | Source : BSEWe hereby submit clippings of Newspaper. Kindly take the same on your records.
Results - Financial Results As On 31.03.2026
21-May-2026 | Source : BSEWe here by submit Financial Results (Standalone and Consolidated) for the Quarter and Year ended 31.03.2026 along with Auditors Report thereon. Kindly take the same on your records.
Corporate Actions

No Upcoming Board Meetings

No Dividend history available

No Splits history available

No Bonus history available

No Rights history available
Quality key factors
Valuation key factors
Technicals key factors
 Technical Indicator Scale: Bearish, Mildly Bearish, Sideways, Mildly Bullish, Bullish Turned
 Shareholding Snapshot : Mar 2026
Shareholding Compare (%holding)
Non Institution
None
Held by 0 Schemes
Held by 0 FIIs
Sarabhai Holdings Private Limited (25.77%)
Haryana Containers Limited (2.28%)
58.67%
Quarterly Results Snapshot (Consolidated) - Mar'26 - QoQ

QoQ Growth in quarter ended Mar 2026 is 25.94% vs 16.99% in Dec 2025

QoQ Growth in quarter ended Mar 2026 is 78.57% vs 750.00% in Dec 2025
Half Yearly Results Snapshot (Consolidated) - Sep'25
Growth in half year ended Sep 2025 is -0.71% vs 12.21% in Sep 2024
Growth in half year ended Sep 2025 is 157.91% vs 178.36% in Sep 2024
Nine Monthly Results Snapshot (Consolidated) - Dec'25
YoY Growth in nine months ended Dec 2025 is 4.13% vs 10.19% in Dec 2024
YoY Growth in nine months ended Dec 2025 is 117.31% vs 311.38% in Dec 2024
Annual Results Snapshot (Consolidated) - Mar'26
YoY Growth in year ended Mar 2026 is 3.10% vs 13.03% in Mar 2025
YoY Growth in year ended Mar 2026 is 261.05% vs -13.20% in Mar 2025
About Ambalal Sarabhai Enterprises Ltd

Company Coordinates


