
Compare Bridge Securitie with Similar Stocks
Stock DNA
Non Banking Financial Company (NBFC)
INR 66 Cr (Micro Cap)
42.00
22
0.00%
0.01
23.39%
9.90
Total Returns (Price + Dividend) 
Bridge Securitie for the last several years.
Risk Adjusted Returns v/s
Returns Beta

News
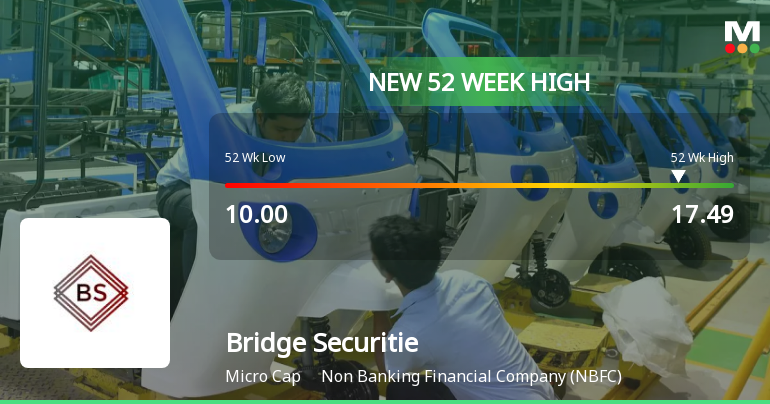
Broad-Based Technical Strength Lifts Bridge Securities Ltd to 52-Week High of Rs 17.49
With a decisive breakthrough to Rs 17.49 on 7 Jul 2026, Bridge Securities Ltd has reached a fresh 52-week high, marking a 59.3% gain over the past year. This milestone is underscored by a strong alignment of technical indicators, signalling robust momentum despite a slight pullback after five consecutive days of gains.
Read full news article

Bridge Securities Ltd is Rated Sell
Bridge Securities Ltd is rated Sell by MarketsMOJO, with this rating last updated on 06 April 2026. However, the analysis and financial metrics presented here reflect the stock’s current position as of 29 June 2026, providing investors with an up-to-date view of the company’s fundamentals, valuation, financial trend, and technical outlook.
Read full news article Announcements
Closure of Trading Window
30-Jun-2026 | Source : BSEIntimation of Closure of Trading Window
Intimation Under Regulation 30 Of The SEBI (Listing Obligations And Disclosure Requirements) Regulations 2015 - Receipt Of Certificate Of Investment Intention
29-Jun-2026 | Source : BSEIntimation under Regulation 30 of SEBI (LODR) 2015 - Receipt of Certificate of Investment Intention
Non-Applicability Of Large Corporate Clause
30-Apr-2026 | Source : BSENon-Applicability of Large Corporate Clause
Corporate Actions

No Upcoming Board Meetings

No Dividend history available

Bridge Securities Ltd has announced 1:10 stock split, ex-date: 10 Jul 24

No Bonus history available

No Rights history available
Quality key factors
Valuation key factors
Technicals key factors
 Technical Indicator Scale: Bearish, Mildly Bearish, Sideways, Mildly Bullish, Bullish Turned
 Shareholding Snapshot : Mar 2026
Shareholding Compare (%holding)
Non Institution
None
Held by 0 Schemes
Held by 0 FIIs
None
Keyventure Enterprises Private Limited (14.67%)
83.49%
Quarterly Results Snapshot (Standalone) - Mar'26 - QoQ

QoQ Growth in quarter ended Mar 2026 is 90.48% vs 0.00% in Dec 2025
QoQ Growth in quarter ended Mar 2026 is 18.18% vs -15.38% in Dec 2025
Half Yearly Results Snapshot (Standalone) - Sep'25

Growth in half year ended Sep 2025 is -19.83% vs 364.00% in Sep 2024
Growth in half year ended Sep 2025 is -18.45% vs 1,960.00% in Sep 2024
Nine Monthly Results Snapshot (Standalone) - Dec'25
YoY Growth in nine months ended Dec 2025 is -29.32% vs 297.92% in Dec 2024
YoY Growth in nine months ended Dec 2025 is -33.52% vs 633.33% in Dec 2024
Annual Results Snapshot (Standalone) - Mar'26
YoY Growth in year ended Mar 2026 is 12.57% vs 138.75% in Mar 2025
YoY Growth in year ended Mar 2026 is 22.05% vs 144.23% in Mar 2025
About Bridge Securities Ltd

Company Coordinates


