
Compare I G Petrochems with Similar Stocks
Dashboard
Company has a Debt to Equity ratio (avg) of 0.03 times
Poor long term growth as Operating profit has grown by an annual rate -37.33% of over the last 5 years
Flat results in Mar 26
With ROE of 0.2, it has a Very Expensive valuation with a 1 Price to Book Value
Despite the size of the company, domestic mutual funds hold only 0% of the company
Consistent Underperformance against the benchmark over the last 3 years
Stock DNA
Commodity Chemicals
INR 1,372 Cr (Micro Cap)
615.00
45
2.26%
0.08
0.17%
1.02
Total Returns (Price + Dividend) 
Latest dividend: 10 per share ex-dividend date: Jul-31-2025
Risk Adjusted Returns v/s
Returns Beta

News

I G Petrochemicals Ltd is Rated Hold by MarketsMOJO
I G Petrochemicals Ltd is rated 'Hold' by MarketsMOJO, with this rating last updated on 18 May 2026. However, the analysis and financial metrics discussed here reflect the stock's current position as of 25 June 2026, providing investors with the most up-to-date view of the company’s fundamentals, returns, and market standing.
Read full news article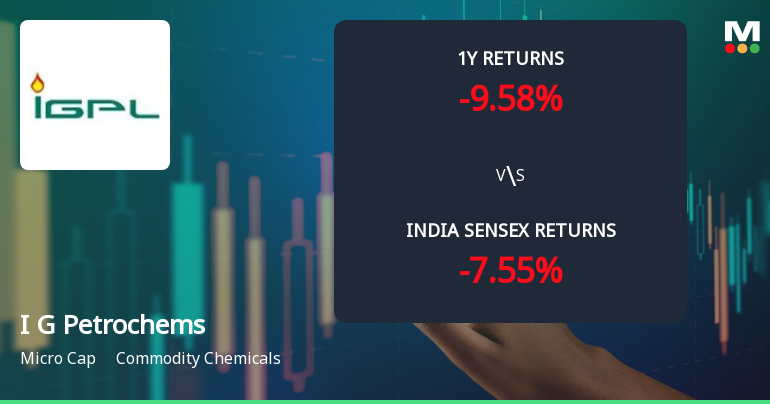
I G Petrochemicals Ltd Technical Momentum Shifts Signal Bullish Outlook
I G Petrochemicals Ltd has witnessed a notable shift in its technical momentum, moving from a mildly bullish stance to a more confident bullish trend. This change is underscored by improvements across key technical indicators including MACD, moving averages, and Bollinger Bands, signalling renewed investor interest in this micro-cap commodity chemicals stock.
Read full news article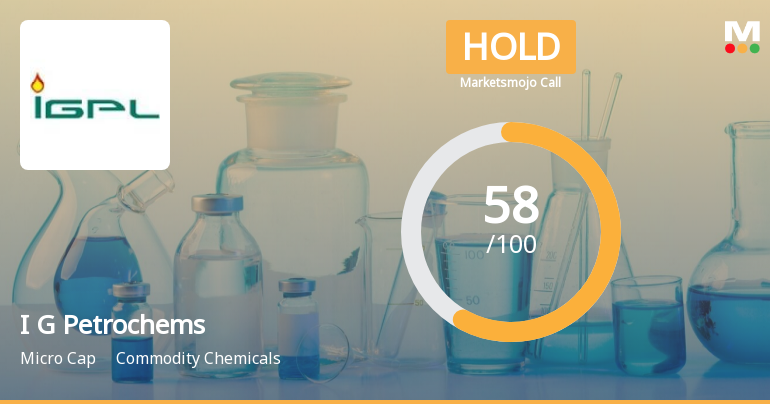
I G Petrochemicals Ltd is Rated Hold by MarketsMOJO
I G Petrochemicals Ltd is rated 'Hold' by MarketsMOJO, with this rating last updated on 18 May 2026. However, the analysis and financial metrics discussed here reflect the company’s current position as of 14 June 2026, providing investors with the most recent insights into its performance and outlook.
Read full news article Announcements
Announcement under Regulation 30 (LODR)-Analyst / Investor Meet - Intimation
15-Jun-2026 | Source : BSEIntimation of Schedule of Analyst/ Institutional Investor meeting on Thursday 18th June 2026 at 04:00 p.m.
Announcement under Regulation 30 (LODR)-Newspaper Publication
06-Jun-2026 | Source : BSECopy of Newspaper Advertisement for transfer of equity shares of the Company to Investor Education and Protection Fund Authority
Compliances-Reg.24(A)-Annual Secretarial Compliance
28-May-2026 | Source : BSEAnnual Secretarial Compliance under Regulation 24(A).
Corporate Actions

No Upcoming Board Meetings

I G Petrochemicals Ltd has declared 100% dividend, ex-date: 31 Jul 25

No Splits history available

No Bonus history available

No Rights history available
Quality key factors
Valuation key factors
Technicals key factors
 Technical Indicator Scale: Bearish, Mildly Bearish, Sideways, Mildly Bullish, Bullish Turned
 Shareholding Snapshot : Mar 2026
Shareholding Compare (%holding)
Promoters
None
Held by 1 Schemes (0.0%)
Held by 29 FIIs (2.92%)
Vincent India Limited (15.4%)
None
19.3%
Quarterly Results Snapshot (Consolidated) - Mar'26 - QoQ

QoQ Growth in quarter ended Mar 2026 is 12.67% vs -0.00% in Dec 2025
QoQ Growth in quarter ended Mar 2026 is 358.47% vs -443.00% in Dec 2025
Half Yearly Results Snapshot (Consolidated) - Sep'25

Growth in half year ended Sep 2025 is -19.92% vs 10.51% in Sep 2024
Growth in half year ended Sep 2025 is -124.49% vs 33.86% in Sep 2024
Nine Monthly Results Snapshot (Consolidated) - Dec'25
YoY Growth in nine months ended Dec 2025 is -18.85% vs 11.72% in Dec 2024
YoY Growth in nine months ended Dec 2025 is -128.81% vs 194.42% in Dec 2024
Annual Results Snapshot (Consolidated) - Mar'26
YoY Growth in year ended Mar 2026 is -12.75% vs 5.11% in Mar 2025
YoY Growth in year ended Mar 2026 is -97.96% vs 175.12% in Mar 2025
About I G Petrochemicals Ltd

Company Coordinates


