
Compare Poddar Pigments with Similar Stocks
Stock DNA
Dyes And Pigments
INR 269 Cr (Micro Cap)
18.00
18
1.63%
-0.06
4.21%
0.74
Total Returns (Price + Dividend) 
Latest dividend: 4 per share ex-dividend date: Sep-19-2025
Risk Adjusted Returns v/s
Returns Beta

News
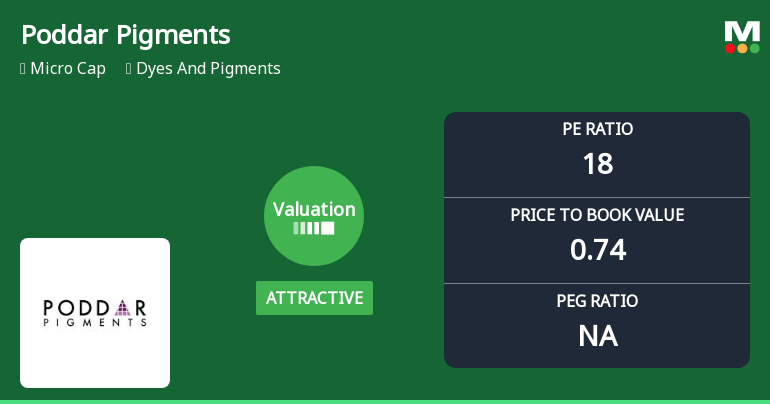
Poddar Pigments Ltd: Valuation Shifts Signal Renewed Price Attractiveness Amid Sector Challenges
Poddar Pigments Ltd., a micro-cap player in the Dyes and Pigments sector, has seen its valuation parameters shift favourably, moving from fair to attractive territory. Despite a challenging performance relative to the Sensex over recent years, the stock’s price-to-earnings (P/E) and price-to-book value (P/BV) ratios now present a compelling case for value-oriented investors seeking opportunities in the sector.
Read full news article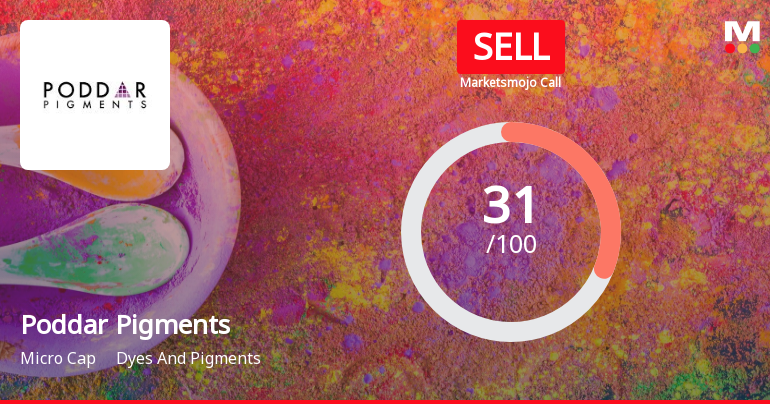
Poddar Pigments Ltd. is Rated Sell by MarketsMOJO
Poddar Pigments Ltd. is rated 'Sell' by MarketsMOJO, with this rating last updated on 07 Apr 2026. However, the analysis and financial metrics discussed here reflect the stock's current position as of 24 June 2026, providing investors with an up-to-date view of the company’s fundamentals, returns, and market performance.
Read full news article
Poddar Pigments Ltd. is Rated Sell by MarketsMOJO
Poddar Pigments Ltd. is rated 'Sell' by MarketsMOJO, with this rating last updated on 07 April 2026. However, the analysis and financial metrics discussed here reflect the stock's current position as of 13 June 2026, providing investors with an up-to-date view of the company’s performance and outlook.
Read full news article Announcements
Closure of Trading Window
25-Jun-2026 | Source : BSEClosure of Trading Window
Announcement under Regulation 30 (LODR)-Newspaper Publication
09-Jun-2026 | Source : BSENewspaper Publication
Compliances-Reg.24(A)-Annual Secretarial Compliance
26-May-2026 | Source : BSEAnnual Secretarial Compliance Report for the year ended 31.03.2026
Corporate Actions

No Upcoming Board Meetings

Poddar Pigments Ltd. has declared 40% dividend, ex-date: 19 Sep 25

No Splits history available

No Bonus history available

No Rights history available
Quality key factors
Valuation key factors
Technicals key factors
 Technical Indicator Scale: Bearish, Mildly Bearish, Sideways, Mildly Bullish, Bullish Turned
 Shareholding Snapshot : Mar 2026
Shareholding Compare (%holding)
Promoters
None
Held by 0 Schemes
Held by 0 FIIs
Espouse Resonance Engineering Llp (42.44%)
Pramila Maheshkumar Bang (2.65%)
26.49%
Quarterly Results Snapshot (Standalone) - Mar'26 - QoQ

QoQ Growth in quarter ended Mar 2026 is 9.49% vs 0.36% in Dec 2025
QoQ Growth in quarter ended Mar 2026 is 110.67% vs -37.50% in Dec 2025
Half Yearly Results Snapshot (Standalone) - Sep'25

Growth in half year ended Sep 2025 is -4.33% vs 5.48% in Sep 2024
Growth in half year ended Sep 2025 is -38.99% vs -1.62% in Sep 2024
Nine Monthly Results Snapshot (Standalone) - Dec'25
YoY Growth in nine months ended Dec 2025 is -2.46% vs 3.77% in Dec 2024
YoY Growth in nine months ended Dec 2025 is -43.35% vs -11.96% in Dec 2024
Annual Results Snapshot (Standalone) - Mar'26
YoY Growth in year ended Mar 2026 is 1.73% vs -0.14% in Mar 2025
YoY Growth in year ended Mar 2026 is -35.32% vs -20.82% in Mar 2025
About Poddar Pigments Ltd.

Company Coordinates


