Bajaj Auto

  • Market Cap: Large Cap
  • Industry: Automobiles
  • ISIN: INE917I01010
  • NSEID: BAJAJ-AUTO
  • BSEID: 532977
INR
10,007.80
-54.75 (-0.54%)
BSENSE

Jun 15, 11:38 AM

BSE+NSE Vol: 1.42 lacs

  • Price Points
  • Score
  • Mojo Parameters
  • Total Return
  • News and Corporate Actions
  • Key factors
  • Shareholding
  • Financials
  • CompanyCV
stock-summaryPrice Point
High/Low

1Day

52 Week

Valuation
Technical
Day's Volume

CASH

1.42 lacs (54.24%) Volume

Shareholding (Mar 2026)

FII

8.82%

Held by 819 FIIs

DII

14.47%

Held by 48 DIIs

Promoter

55.01%

Why is Bajaj Auto Ltd. falling/rising?

15-Jun-2026

As of 14-Jun, Bajaj Auto Ltd. is facing a decline in its stock price, currently at 10,062.55, having fallen for six consecutive days and underperforming the sector. Despite strong long-term fundamentals, recent market sentiment and decreased investor participation are contributing to its current challenges.

As of 14-Jun, Bajaj Auto Ltd. is experiencing a decline in its stock price, currently at 10,062.55, which reflects a change of -55.5 (-0.55%). The stock has been underperforming, having fallen for the last six consecutive days, resulting in a total decline of -2.89% during this period. Additionally, the stock's performance today has underperformed the sector by -1.36%.<BR><BR>In terms of broader market performance, the stock has shown a negative trend over the past week and month, with declines of -2.69% and -3.09%, respectively, while the benchmark Sensex has increased by +1.73% and +1.30% during the same periods. This indicates that Bajaj Auto Ltd. is not keeping pace with the overall market.<BR><BR>Investor participation has also decreased, with delivery volume dropping by -41.12% compared to the five-day average, suggesting reduced interest from investors. Although the stock remains liquid enough for trading, the weighted average price indicates that more volume has been traded closer to the low price, which may reflect bearish sentiment.<BR><BR>Despite these short-term challenges, the company has strong long-term fundamentals, including a solid return on equity and healthy growth in net sales and operating profit. However, the current market sentiment and recent performance metrics are contributing to the stock's decline.

View full answer

What does Bajaj Auto do?

11-Jun-2026

Bajaj Auto Limited is a major Indian manufacturer of two and three-wheelers, recognized as the largest exporter in this sector. As of March 2026, it reported net sales of ₹17,832 Cr and a net profit of ₹3,662 Cr, with a market cap of ₹287,067 Cr.

Overview:<BR>Bajaj Auto Limited (BAL) is a leading manufacturer of two and three-wheelers in India, operating within the automobiles industry and classified as a large-cap company.<BR><BR>History:<BR>Bajaj Auto was incorporated in the year 1945. It is recognized as the largest exporter of two and three-wheelers in India. The latest quarterly results reported are for March 2026, showcasing the company's performance in net sales and profit.<BR><BR>Financial Snapshot:<BR>- Net Sales: 17,832 Cr (Quarterly Results - Mar 2026)<BR>- Net Profit: 3,662 Cr (Quarterly Results - Mar 2026)<BR>- Market Cap: INR 287,067 Cr (Large Cap)<BR><BR>Key Metrics:<BR>- P/E: 26.00<BR>- Industry P/E: 29<BR>- Dividend Yield: 1.47%<BR>- Debt-Equity: 0.30<BR>- Return on Equity: 27.74%<BR>- Price to Book: 7.33<BR><BR>Contact Details:<BR>Address: Bajaj Auto Limited Complex, Mumbai - Pune Road Akurdi Pune Maharashtra : 411035<BR>Phone: 91-20-2747 2851<BR>Email: investors@bajajauto.co.in<BR>Website: http://www.bajajauto.com

View full answer

How big is Bajaj Auto?

11-Jun-2026

As of 10th June, Bajaj Auto Ltd. has a market capitalization of 287,067.00 Cr, with net sales of 62,905.00 Cr and a net profit of 10,744.21 Cr reported in the latest four quarters. Shareholder's funds are 35,188.74 Cr, and total assets amount to 54,109.92 Cr.

As of 10th June, Bajaj Auto Ltd. has a market capitalization of 287,067.00 Cr, categorizing it as a Large Cap company.<BR><BR>In the latest four quarters, Bajaj Auto reported net sales of 62,905.00 Cr and a net profit of 10,744.21 Cr.<BR><BR>For the latest annual period ending in March 2025, Bajaj Auto's shareholder's funds amounted to 35,188.74 Cr, while total assets were reported at 54,109.92 Cr.

View full answer

Who are in the management team of Bajaj Auto?

11-Jun-2026

The management team of Bajaj Auto includes key individuals such as Madhur Bajaj (Vice Chairman), Rajiv Bajaj (Managing Director & CEO), and Niraj Bajaj (Chairman), along with several independent directors and executive members who guide the company's strategic decisions.

The management team of Bajaj Auto includes the following key individuals:<BR><BR>1. **Madhur Bajaj** - Vice Chairman<BR>2. **Rajiv Bajaj** - Managing Director & CEO<BR>3. **Sanjiv Bajaj** - Director<BR>4. **D J Balaji Rao** - Independent Director<BR>5. **Niraj Bajaj** - Chairman (Non-Executive)<BR>6. **J Sridhar** - Company Secretary & Compliance Officer<BR>7. **Pradeep Shrivastava** - Executive Director<BR>8. **Naushad Forbes** - Independent Director<BR>9. **Anami Roy** - Independent Director<BR>10. **Rakesh Sharma** - Executive Director<BR>11. **Lila Poonawalla** - Independent Director<BR>12. **Pradip Shah** - Independent Director<BR>13. **Abhinav Bindra** - Independent Director<BR><BR>This team plays a crucial role in steering the company and making strategic decisions.

View full answer

Who are the peers of the Bajaj Auto?

11-Jun-2026

Bajaj Auto's peers include Maruti Suzuki, M & M, Eicher Motors, TVS Motor Co., Hyundai Motor I, Tata Motors PVeh, Hero MotoCorp, Ashok Leyland, and Ather Energy. In terms of performance, Ather Energy leads with a 1-year return of 233.55%, while Tata Motors PVeh has the lowest at -16.93%, with Bajaj Auto at 16.65%.

Peers: The peers of Bajaj Auto are Maruti Suzuki, M & M, Eicher Motors, TVS Motor Co., Hyundai Motor I, Tata Motors PVeh, Hero MotoCorp, Ashok Leyland, and Ather Energy.<BR><BR>Quality Snapshot: Excellent management risk is observed at Bajaj Auto, Hyundai Motor I, and Hero MotoCorp, while Good management risk is found at Maruti Suzuki, M & M, Eicher Motors, TVS Motor Co., Ashok Leyland, and Tata Motors PVeh, and the rest. For Growth, Excellent growth is noted at Bajaj Auto, Maruti Suzuki, M & M, Eicher Motors, TVS Motor Co., Hyundai Motor I, and Ashok Leyland, while Good growth is seen at Hero MotoCorp, Average growth at Ather Energy, and Below Average growth at Tata Motors PVeh. In terms of Capital Structure, Excellent capital structure is present at Bajaj Auto, Maruti Suzuki, Eicher Motors, and Hyundai Motor I, while Below Average capital structure is found at M & M, TVS Motor Co., Ashok Leyland, and Ather Energy, and Average capital structure at Tata Motors PVeh.<BR><BR>Return Snapshot: The peer with the highest 1-year return is Ather Energy at 233.55%, while Tata Motors PVeh has the lowest at -16.93%. Bajaj Auto's own 1-year return is 16.65%, which is significantly higher than Tata Motors PVeh but lower than Ather Energy. Additionally, peers with a negative six-month return include Maruti Suzuki, M & M, TVS Motor Co., Hyundai Motor I, Tata Motors PVeh, Hero MotoCorp, and Ashok Leyland.

View full answer

Has Bajaj Auto Ltd. declared dividend?

08-May-2026

Yes, Bajaj Auto Ltd. has declared a dividend of 1500% (₹80 per share) with an ex-date of June 14, 2024. The company has shown strong total returns across various periods, with a 1-year total return of 41.03%.

Bajaj Auto Ltd. has declared a dividend.<BR><BR>Dividend Details:<BR>- Percentage announced: 1500%<BR>- Amount per share: 80<BR>- Ex-date: Jun-14-2024<BR><BR>Dividend Yield: 0%<BR><BR>Total Returns by Period:<BR>In the 3-month period, Bajaj Auto Ltd. achieved a price return of 12.53%, a dividend return of 1.57%, resulting in a total return of 14.1%.<BR><BR>In the 6-month period, the company recorded a price return of 22.77%, a dividend return of 1.71%, leading to a total return of 24.48%.<BR><BR>For the 1-year period, Bajaj Auto Ltd. experienced a price return of 39.17%, a dividend return of 1.86%, culminating in a total return of 41.03%.<BR><BR>Over the 2-year period, the price return was 22.4%, with a dividend return of 2.61%, resulting in a total return of 25.01%.<BR><BR>In the 3-year period, the company saw a remarkable price return of 135.89%, a dividend return of 8.19%, which led to a total return of 144.08%.<BR><BR>During the 4-year period, Bajaj Auto Ltd. achieved a price return of 206.22%, a dividend return of 13.23%, resulting in an impressive total return of 219.45%.<BR><BR>In the 5-year period, the company recorded a price return of 176.97%, a dividend return of 15.21%, culminating in a total return of 192.18%.<BR><BR>Overall, Bajaj Auto Ltd. has declared a significant dividend while also demonstrating strong total returns across various periods, indicating a robust financial performance.

View full answer

Are Bajaj Auto Ltd. latest results good or bad?

07-May-2026

Bajaj Auto Ltd.'s latest Q4 FY26 results are strong, with a net profit of ₹3,661.92 crores (up 103.23% year-on-year) and net sales of ₹17,832.46 crores (up 41.01%). Despite a contraction in operating margins due to rising costs, the overall performance is positive, indicating a strong financial position.

Bajaj Auto Ltd.'s latest results for Q4 FY26 can be considered quite strong overall. The company reported a consolidated net profit of ₹3,661.92 crores, which marks an impressive year-on-year growth of 103.23%. Additionally, net sales reached ₹17,832.46 crores, reflecting a robust increase of 41.01% compared to the same quarter last year.<BR><BR>However, there are some challenges to note. The operating margin (excluding other income) contracted to 17.98%, down from 24.25% in the previous quarter, indicating some pressure on profitability due to rising input costs and competitive intensity.<BR><BR>Despite the margin compression, the overall financial performance is positive, highlighted by record sales and profit figures. The company has also shown strong capital efficiency, with a return on equity of 23.08%. Furthermore, Bajaj Auto's stock has performed well, delivering significant returns over the past year.<BR><BR>In summary, while there are some concerns regarding margins, the substantial growth in sales and profits suggests that Bajaj Auto is in a strong position, making the latest results largely favorable.

View full answer

Should I buy, sell or hold Bajaj Auto Ltd.?

07-May-2026

Is Bajaj Auto overvalued or undervalued?

29-Nov-2025

As of November 28, 2025, Bajaj Auto is fairly valued with a PE ratio of 30.47 and strong returns, despite recent stock performance lagging behind the Sensex.

As of 28 November 2025, Bajaj Auto's valuation grade has moved from expensive to fair, indicating a more favorable assessment of its market position. The company is currently fairly valued, with a PE ratio of 30.47, an EV to EBITDA of 22.82, and a PEG ratio of 2.34. In comparison to peers, Eicher Motors is considered very expensive with a PE of 37.85, while TVS Motor Co. is also fairly valued with a significantly higher PE of 64.33.<BR><BR>Bajaj Auto's strong return on capital employed (ROCE) at 23.72% and return on equity (ROE) at 24.38% further support its valuation status. Despite its recent stock performance lagging behind the Sensex over the year, with a return of 0.83% compared to the Sensex's 8.43%, the company's fundamentals suggest it is positioned well within the automobile sector.

View full answer

Is Bajaj Auto technically bullish or bearish?

28-Nov-2025

As of November 27, 2025, the trend is mildly bullish due to positive weekly indicators, but caution is advised due to mixed signals from the monthly data.

As of 27 November 2025, the technical trend has changed from bullish to mildly bullish. The current stance is mildly bullish, driven primarily by the weekly MACD indicating bullish momentum and the daily moving averages also showing bullish signals. However, the monthly MACD and KST are mildly bearish, suggesting caution. The RSI on the monthly timeframe is bullish, providing some support. Overall, while there are positive indicators, the mixed signals from the monthly data indicate a need for careful observation.

View full answer

How has been the historical performance of Bajaj Auto?

09-Nov-2025

Bajaj Auto has shown consistent growth in net sales and profits, with net sales increasing from INR 27,741.08 crore in March 2021 to INR 50,994.55 crore in March 2025, while total assets rose to INR 54,109.92 crore. However, profit after tax fluctuated, peaking at INR 8,240.21 crore in March 2025, and cash flow from operating activities turned negative at INR -1,405 crore in the same year.

Answer:<BR>The historical performance of Bajaj Auto shows a consistent growth trajectory in net sales and profits over the years leading up to March 2025.<BR><BR>Breakdown:<BR>Bajaj Auto's net sales have steadily increased from INR 27,741.08 crore in March 2021 to INR 50,994.55 crore in March 2025, reflecting a strong upward trend. The total operating income followed a similar pattern, rising from INR 27,741.08 crore in March 2021 to INR 50,994.55 crore in March 2025. Operating profit (PBDIT) also saw significant growth, climbing from INR 4,924.68 crore in March 2021 to INR 11,942.14 crore in March 2025, indicating improved operational efficiency. However, the profit after tax (PAT) showed fluctuations, peaking at INR 8,240.21 crore in March 2025, down from INR 7,440.65 crore in March 2024. The company's total assets increased from INR 26,510.02 crore in March 2020 to INR 54,109.92 crore in March 2025, while total liabilities rose from INR 26,510.02 crore to INR 9,364.16 crore during the same period. Cash flow from operating activities turned negative in March 2025 at INR -1,405 crore, contrasting with a positive cash flow of INR 6,558 crore in March 2024. Overall, Bajaj Auto demonstrates robust growth in revenue and assets, despite some volatility in profit margins and cash flow.

View full answer

Who are the top shareholders of the Bajaj Auto?

17-Jul-2025

The top shareholders of Bajaj Auto include Bajaj Holdings and Investment Limited with 34.21%, followed by foreign institutional investors at 11.61%, mutual funds at 6.54%, and individual investors holding 9.95%. The promoter group retains a significant stake in the company.

The top shareholders of Bajaj Auto include several key players. The majority of the shares are held by promoters, with Bajaj Holdings and Investment Limited being the largest promoter, holding 34.21% of the shares. Additionally, there are 41 mutual fund schemes that collectively hold 6.54%, and foreign institutional investors (FIIs) own 11.61% through 912 different entities. The highest public shareholder is Jaya Hind Industries Private Limited, which holds 3.56%. Individual investors account for 9.95% of the company's shares. Overall, the promoter group maintains a significant stake in Bajaj Auto.

View full answer

When is the next results date for Bajaj Auto?

06-Jun-2025

No Upcoming Board Meetings

What is the bonus history of the Bajaj Auto?

06-Jun-2025

Bajaj Auto's most recent bonus issue was a 1:1 bonus announced on September 8, 2010, with a record date of September 10, 2010, allowing shareholders to receive one additional share for each share held.

Bajaj Auto has a notable bonus history, with its most recent bonus issue being a 1:1 bonus announced on September 8, 2010. The record date for this bonus was September 10, 2010. This means that shareholders received one additional share for every share they held as of the record date.

View full answer
iScoreScore
Part of MojoOne Strategy
Click here to find our call on this stock
Strong Sell
Sell
Hold
Buy
Strong Buy

Dashboard

1

Strong Long Term Fundamental Strength with an average Return on Equity (ROE) of 22.84%

  • Healthy long term growth as Net Sales has grown by an annual rate of 17.79% and Operating profit at 21.63%
  • Company has a Debt to Equity ratio (avg) of 0.06 times
2

Positive results in Mar 26

3

High Institutional Holdings at 23.29%

4

Company is among the highest 1% of companies rated by MarketsMojo across all 4,000 stocks

 
5

Market Beating performance in long term as well as near term

6

With its market cap of Rs 2,81,246 cr, it is the biggest company in the sector and constitutes 35.05% of the entire sector

stock-summaryMojo Parameters

Mojo Parameters

Loading Valuation Snapshot...

Stock DNA

stock-summary
Industry

Automobiles

stock-summary
Market cap

INR 279,716 Cr (Large Cap)

stock-summary
P/E

26.00

stock-summary
Industry P/E

29

stock-summary
Dividend Yield

1.49%

stock-summary
Debt Equity

0.30

stock-summary
Return on Equity

27.74%

stock-summary
Price to Book

7.24

Revenue and Profits:
Net Sales:
17,832 Cr
(Quarterly Results - Mar 2026)
Net Profit:
3,662 Cr
stock-summaryTotal Returns
Total Returns (Price + Dividend) stock-summary
Dividend Yield (1.49%)
TimePeriod
Price Return
Dividend Return
Total Return
3 Months
12.7%
1.65%
14.35%
6 Months
12.02%
1.69%
13.71%
1 Year
18.24%
1.79%
20.03%
2 Years
0.49%
1.55%
2.04%
3 Years
112.38%
4.99%
117.37%
4 Years
170.77%
9.81%
180.58%
5 Years
141.85%
12.88%
154.73%

Latest dividend: 150 per share ex-dividend date: May-29-2026

Risk Adjusted Returns v/s stock-summary
Returns Beta
Icon
Beta has not been calculated since enough price history is not available
stock-summaryNews & Corporate Actions

News

P/E at 26.11 vs Industry's 29.27: What the Data Shows for Bajaj Auto Ltd.

Valuation Picture: A Slight Discount in a High-Performing Sector

Bajaj Auto Ltd. trades at a P/E of 26.11, which is approximately 10.8% below the industry average of 29.27. This valuation gap suggests the market is pricing in a degree of caution relative to peers in the automobile sector. Given the sector’s broad performance, with 145 stocks reporting positive results out of 442, the discount may reflect company-specific factors or a more conservative outlook on near-term earnings growth. The P/E differential invites the question previously rated Buy, what is Read full news article
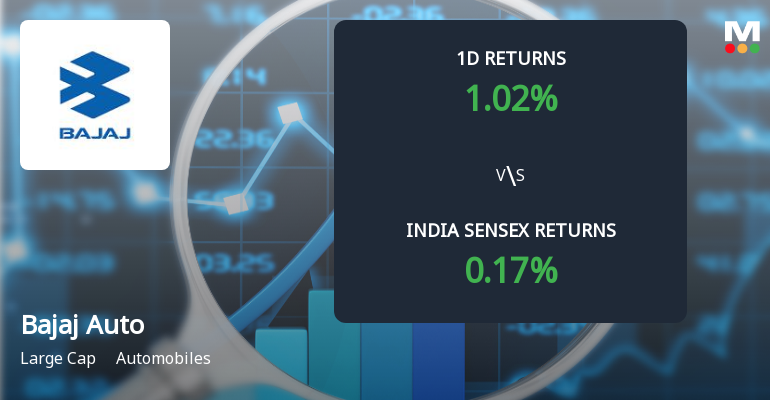
Bajaj Auto Declines 2.69% Amid Rising Derivatives Activity: 2 Key Market Signals

Announcements stock-summary

Regulation 30 Of The Securities And Exchange Board Of India (Listing Obligations And Disclosure Requirements) Regulations 2015 (Listing Regulations 2015)

09-Jun-2026 | Source : BSE

Intimation under Regulation 30 - Favourable order from Commissioner (Appeals) Guwahati

Announcement Under Regulation 30 Of SEBI LODR Regarding Intimation Letter Sent To Shareholders For KYC Updation.

04-Jun-2026 | Source : BSE

Intimation sent to shareholders on 4 June 2026 as per SEBI Master Circular dated 6 February 2026 to Registrars to an Issue and Share Transfer Agents for updation of required KYC details.

Communication Sent To Shareholders Regarding Tax Deduction At Source (TDS) On Dividend

01-Jun-2026 | Source : BSE

Company has sent a detailed communication to all the shareholders today holding shares as on Friday 29 May 2026 whose email IDs are registered with the Company/Depository regarding TDS and claiming exemption.

Corporate Actions stock-summary

stock-summary
BOARD MEETING

No Upcoming Board Meetings

stock-summary
DIVIDEND

Bajaj Auto Ltd. has declared 1500% dividend, ex-date: 29 May 26

stock-summary
SPLITS

No Splits history available

stock-summary
BONUS

Bajaj Auto Ltd. has announced 1:1 bonus issue, ex-date: 08 Sep 10

stock-summary
RIGHTS

No Rights history available

stock-summaryKey Factors

Quality key factors stock-summary

Factor
Value
Sales Growth (5y)
17.79%
EBIT Growth (5y)
21.63%
EBIT to Interest (avg)
100.00
Debt to EBITDA (avg)
0.52
Net Debt to Equity (avg)
0.30
Sales to Capital Employed (avg)
1.23
Tax Ratio
24.21%
Dividend Payout Ratio
28.97%
Pledged Shares
0.01%
Institutional Holding
23.29%
ROCE (avg)
27.29%
ROE (avg)
22.84%

Valuation key factors

Factor
Value
P/E Ratio
26
Industry P/E
29
Price to Book Value
7.24
EV to EBIT
23.60
EV to EBITDA
22.44
EV to Capital Employed
5.79
EV to Sales
4.66
PEG Ratio
0.56
Dividend Yield
1.49%
ROCE (Latest)
24.51%
ROE (Latest)
27.74%

Technicals key factors

Indicator
Weekly
Monthly
MACD
Bullish
Bullish
RSI
No Signal
No Signal
Bollinger Bands
Mildly Bullish
Mildly Bullish
Moving Averages
Bullish (Daily)
KST
Bullish
Bullish
Dow Theory
Mildly Bearish
Mildly Bullish
OBV
Mildly Bearish
No Trend
stock-summary Technical Indicator Scale: Bearish, Mildly Bearish, Sideways, Mildly Bullish, Bullish  Turned 
stock-summaryShareholding
Shareholding Snapshot : Mar 2026stock-summary
Shareholding Compare (%holding) stock-summary
Majority shareholders

Promoters

Pledged Promoter Holdings

0.009

Mutual Funds

Held by 46 Schemes (7.17%)

FIIs

Held by 819 FIIs (8.82%)

Promoter with highest holding

Bajaj Holdings And Investment Limited (34.19%)

Highest Public shareholder

Life Insurance Corporation Of India - Ulif00320091 (4.8%)

Individual Investors Holdings

9.28%

stock-summaryFinancial
[
  {
    "link": "quarterly",
    "btn_text": "All Quarterly Results",
    "header": "Quarterly Results Snapshot (Consolidated) - Mar'26 - YoY",
    "rhs": [
      {
        "prefix": "Net Sales ",
        "suffix": "YoY Growth in quarter ended Mar 2026 is 41.01% vs 9.45% in Mar 2025",
        "dir": 1
      },
      {
        "prefix": "Consolidated Net Profit ",
        "suffix": "YoY Growth in quarter ended Mar 2026 is 103.23% vs -10.42% in Mar 2025",
        "dir": 1
      }
    ],
    "table": {
      "header": [
        "Mar'26",
        "Mar'25",
        "Change(%)"
      ],
      "body": [
        {
          "field": "Net Sales",
          "val1": "17,832.46",
          "val2": "12,646.32",
          "chgp": "41.01%",
          "chgp_class": "positive"
        },
        {
          "field": "Operating Profit (PBDIT) excl Other Income",
          "val1": "3,075.22",
          "val2": "2,692.93",
          "chgp": "14.20%",
          "chgp_class": "positive"
        },
        {
          "field": "Interest",
          "val1": "344.36",
          "val2": "146.52",
          "chgp": "135.03%",
          "chgp_class": "negative"
        },
        {
          "field": "Exceptional Items",
          "val1": "37.52",
          "val2": "0.00",
          "chgp": "",
          "chgp_class": "neutral"
        },
        {
          "field": "Consolidate Net Profit",
          "val1": "3,661.92",
          "val2": "1,801.85",
          "chgp": "103.23%",
          "chgp_class": "positive"
        },
        {
          "field": "Operating Profit Margin (Excl OI)",
          "val1": "17.98%",
          "val2": "22.07%",
          "chgp": "-4.09%",
          "chgp_class": "negative"
        }
      ]
    }
  },
  {
    "link": "half-yearly",
    "btn_text": "All Half Yearly Results",
    "header": "Half Yearly Results Snapshot (Consolidated) - Sep'25",
    "rhs": [
      {
        "prefix": "Net Sales ",
        "suffix": " Growth in half year ended Sep 2025 is 14.65% vs 19.05% in Sep 2024",
        "dir": -1
      },
      {
        "prefix": "Consolidated Net Profit ",
        "suffix": " Growth in half year ended Sep 2025 is 30.21% vs -9.20% in Sep 2024",
        "dir": 1
      }
    ],
    "table": {
      "header": [
        "Sep'25",
        "Sep'24",
        "Change(%)"
      ],
      "body": [
        {
          "field": "Net Sales",
          "val1": "28,868.09",
          "val2": "25,179.35",
          "chgp": "14.65%",
          "chgp_class": "positive"
        },
        {
          "field": "Operating Profit (PBDIT) excl Other Income",
          "val1": "6,256.10",
          "val2": "5,023.97",
          "chgp": "24.53%",
          "chgp_class": "positive"
        },
        {
          "field": "Interest",
          "val1": "510.60",
          "val2": "122.17",
          "chgp": "317.94%",
          "chgp_class": "negative"
        },
        {
          "field": "Exceptional Items",
          "val1": "0.00",
          "val2": "0.00",
          "chgp": "",
          "chgp_class": "neutral"
        },
        {
          "field": "Consolidate Net Profit",
          "val1": "4,332.47",
          "val2": "3,327.23",
          "chgp": "30.21%",
          "chgp_class": "positive"
        },
        {
          "field": "Operating Profit Margin (Excl OI)",
          "val1": "22.42%",
          "val2": "20.61%",
          "chgp": "1.81%",
          "chgp_class": "positive"
        }
      ]
    }
  },
  {
    "link": "nine-monthly",
    "btn_text": "All Nine Monthly Results",
    "header": "Nine Monthly Results Snapshot (Consolidated) - Dec'25",
    "rhs": [
      {
        "prefix": "Net Sales ",
        "suffix": "YoY Growth in nine months ended Dec 2025 is 17.53% vs 15.11% in Dec 2024",
        "dir": 1
      },
      {
        "prefix": "Consolidated Net Profit ",
        "suffix": "YoY Growth in nine months ended Dec 2025 is 28.24% vs -3.05% in Dec 2024",
        "dir": 1
      }
    ],
    "table": {
      "header": [
        "Dec'25",
        "Dec'24",
        "Change(%)"
      ],
      "body": [
        {
          "field": "Net Sales",
          "val1": "45,072.54",
          "val2": "38,348.23",
          "chgp": "17.53%",
          "chgp_class": "positive"
        },
        {
          "field": "Operating Profit (PBDIT) excl Other Income",
          "val1": "9,985.85",
          "val2": "7,774.80",
          "chgp": "28.44%",
          "chgp_class": "positive"
        },
        {
          "field": "Interest",
          "val1": "824.23",
          "val2": "242.38",
          "chgp": "240.06%",
          "chgp_class": "negative"
        },
        {
          "field": "Exceptional Items",
          "val1": "-76.73",
          "val2": "0.00",
          "chgp": "",
          "chgp_class": "neutral"
        },
        {
          "field": "Consolidate Net Profit",
          "val1": "7,082.29",
          "val2": "5,522.88",
          "chgp": "28.24%",
          "chgp_class": "positive"
        },
        {
          "field": "Operating Profit Margin (Excl OI)",
          "val1": "22.16%",
          "val2": "20.27%",
          "chgp": "1.89%",
          "chgp_class": "positive"
        }
      ]
    }
  },
  {
    "link": "annual",
    "btn_text": "All Annual Results",
    "header": "Annual Results Snapshot (Consolidated) - Mar'26",
    "rhs": [
      {
        "prefix": "Net Sales ",
        "suffix": "YoY Growth in year ended Mar 2026 is 23.36% vs 13.65% in Mar 2025",
        "dir": 1
      },
      {
        "prefix": "Consolidated Net Profit ",
        "suffix": "YoY Growth in year ended Mar 2026 is 46.68% vs -4.98% in Mar 2025",
        "dir": 1
      }
    ],
    "table": {
      "header": [
        "Mar'26",
        "Mar'25",
        "Change(%)"
      ],
      "body": [
        {
          "field": "Net Sales",
          "val1": "62,905.00",
          "val2": "50,994.55",
          "chgp": "23.36%",
          "chgp_class": "positive"
        },
        {
          "field": "Operating Profit (PBDIT) excl Other Income",
          "val1": "13,061.07",
          "val2": "10,467.73",
          "chgp": "24.77%",
          "chgp_class": "positive"
        },
        {
          "field": "Interest",
          "val1": "1,168.59",
          "val2": "388.90",
          "chgp": "200.49%",
          "chgp_class": "negative"
        },
        {
          "field": "Exceptional Items",
          "val1": "-39.21",
          "val2": "0.00",
          "chgp": "",
          "chgp_class": "neutral"
        },
        {
          "field": "Consolidate Net Profit",
          "val1": "10,744.21",
          "val2": "7,324.73",
          "chgp": "46.68%",
          "chgp_class": "positive"
        },
        {
          "field": "Operating Profit Margin (Excl OI)",
          "val1": "21.63%",
          "val2": "21.25%",
          "chgp": "0.38%",
          "chgp_class": "positive"
        }
      ]
    }
  }
]

Quarterly Results Snapshot (Consolidated) - Mar'26 - YoYstock-summary

Mar'26
Mar'25
Change(%)
Net Sales
17,832.46
12,646.32
41.01%
Operating Profit (PBDIT) excl Other Income
3,075.22
2,692.93
14.20%
Interest
344.36
146.52
135.03%
Exceptional Items
37.52
0.00
Consolidate Net Profit
3,661.92
1,801.85
103.23%
Operating Profit Margin (Excl OI)
17.98%
22.07%
-4.09%
Values in Rs Cr.
Direction Arrows
Net Sales

YoY Growth in quarter ended Mar 2026 is 41.01% vs 9.45% in Mar 2025

Direction Arrows
Consolidated Net Profit

YoY Growth in quarter ended Mar 2026 is 103.23% vs -10.42% in Mar 2025

Half Yearly Results Snapshot (Consolidated) - Sep'25stock-summary

Sep'25
Sep'24
Change(%)
Net Sales
28,868.09
25,179.35
14.65%
Operating Profit (PBDIT) excl Other Income
6,256.10
5,023.97
24.53%
Interest
510.60
122.17
317.94%
Exceptional Items
0.00
0.00
Consolidate Net Profit
4,332.47
3,327.23
30.21%
Operating Profit Margin (Excl OI)
22.42%
20.61%
1.81%
Values in Rs Cr.
Direction Arrows
Net Sales

Growth in half year ended Sep 2025 is 14.65% vs 19.05% in Sep 2024

Direction Arrows
Consolidated Net Profit

Growth in half year ended Sep 2025 is 30.21% vs -9.20% in Sep 2024

Nine Monthly Results Snapshot (Consolidated) - Dec'25stock-summary

Dec'25
Dec'24
Change(%)
Net Sales
45,072.54
38,348.23
17.53%
Operating Profit (PBDIT) excl Other Income
9,985.85
7,774.80
28.44%
Interest
824.23
242.38
240.06%
Exceptional Items
-76.73
0.00
Consolidate Net Profit
7,082.29
5,522.88
28.24%
Operating Profit Margin (Excl OI)
22.16%
20.27%
1.89%
Values in Rs Cr.
Direction Arrows
Net Sales

YoY Growth in nine months ended Dec 2025 is 17.53% vs 15.11% in Dec 2024

Direction Arrows
Consolidated Net Profit

YoY Growth in nine months ended Dec 2025 is 28.24% vs -3.05% in Dec 2024

Annual Results Snapshot (Consolidated) - Mar'26stock-summary

Mar'26
Mar'25
Change(%)
Net Sales
62,905.00
50,994.55
23.36%
Operating Profit (PBDIT) excl Other Income
13,061.07
10,467.73
24.77%
Interest
1,168.59
388.90
200.49%
Exceptional Items
-39.21
0.00
Consolidate Net Profit
10,744.21
7,324.73
46.68%
Operating Profit Margin (Excl OI)
21.63%
21.25%
0.38%
Values in Rs Cr.
Direction Arrows
Net Sales

YoY Growth in year ended Mar 2026 is 23.36% vs 13.65% in Mar 2025

Direction Arrows
Consolidated Net Profit

YoY Growth in year ended Mar 2026 is 46.68% vs -4.98% in Mar 2025

stock-summaryCompany CV
About Bajaj Auto Ltd. stock-summary
stock-summary
Bajaj Auto Ltd.
Large Cap
Automobiles
Bajaj Auto Limited (BAL) is one of the leading two & three wheeler manufacturers in India. The company is the largest exporter of two and three-wheeler in the country. Presently, it is engaged in development, manufacturing and distribution of automobiles such as motorcycles, commercial vehicles, electric two-wheelers etc. and parts thereof. The Company has two Indian subsidiaries, viz. Chetak Technology Ltd. and Bajaj Auto Credit Ltd. and five overseas subsidiaries, viz.
Company Coordinates stock-summary
Company Details
Bajaj Auto Limited Complex, Mumbai - Pune Road Akurdi Pune Maharashtra : 411035
stock-summary
Tel: 91-20-2747 2851
stock-summary
investors@bajajauto.co.in
Registrar Details
Karvy Computershare Pvt Ltd, Plot No 17-24 , Near Image Hospital,, Reliance Cybervilae,Vithalrao Nagar,, Madhapur, Hyderabad