
Compare Sampann Utpadan with Similar Stocks
Dashboard
High Debt Company with a Debt to Equity ratio (avg) of 10.25 times
- High Debt Company with a Debt to Equity ratio (avg) of 10.25 times
- The company has been able to generate a Return on Equity (avg) of 2.97% signifying low profitability per unit of shareholders funds
Falling Participation by Institutional Investors
Underperformed the market in the last 1 year
Stock DNA
Industrial Products
INR 133 Cr (Micro Cap)
20.00
23
0.00%
2.10
14.85%
2.90
Total Returns (Price + Dividend) 
Sampann Utpadan for the last several years.
Risk Adjusted Returns v/s
Returns Beta

News
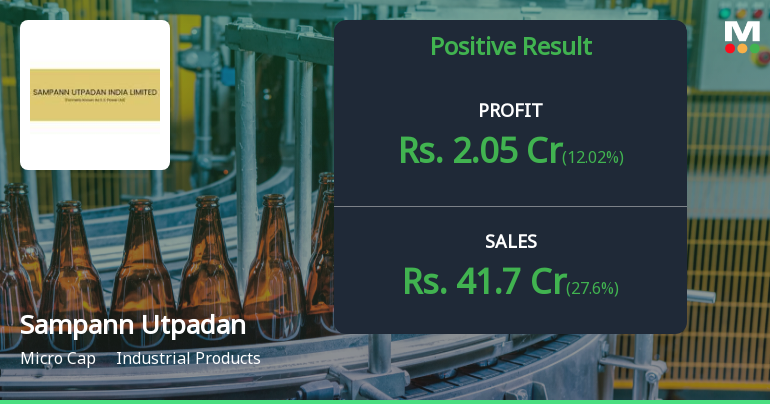
Sampann Utpadan Q1 FY27: Revenue Surge Masks Profitability Concerns
Sampann Utpadan India Ltd., a micro-cap industrial products manufacturer operating in non-conventional energy and reclaimed rubber segments, reported a mixed performance for Q1 FY27, with net profit rising 70.83% quarter-on-quarter to ₹2.05 crores but advancing only 12.02% year-on-year. The company's shares, trading at ₹27.98 on the NSE, remain under pressure, down 16.13% year-to-date and 35.52% below their 52-week high of ₹43.39, reflecting investor concerns about sustainability of the recent recovery.
Read full news articleWhen is the next results date for Sampann Utpadan India Ltd?
The next results date for Sampann Utpadan India Ltd is scheduled for 29 July 2026....
Read full news article
Sampann Utpadan India Ltd is Rated Sell
Sampann Utpadan India Ltd is rated 'Sell' by MarketsMOJO, with this rating last updated on 25 April 2026. However, the analysis and financial metrics discussed here reflect the stock's current position as of 19 July 2026, providing investors with an up-to-date view of the company’s fundamentals, returns, and market performance.
Read full news article Announcements
Board Meeting Intimation for Board Meeting To Be Schedule For Unaudited Financial Results For The Quarter Ended 30.06.2026
20-Jul-2026 | Source : BSESampann Utpadan India Ltdhas informed BSE that the meeting of the Board of Directors of the Company is scheduled on 29/07/2026 inter alia to consider and approve The Meeting of the Board of Directors of the Company is scheduled on 29.07.2026 to consider and approve the Unaudited Financial Results for the Quarter Ended 30.06.2026
Compliances-Certificate under Reg. 74 (5) of SEBI (DP) Regulations 2018
08-Jul-2026 | Source : BSECertificate Under Regulation 74(5) of SEBI (DP) Regulation 2018 for the quarter ended 30.06.2026
Closure of Trading Window
26-Jun-2026 | Source : BSEIntimation for Closure of Trading Window
Corporate Actions

(29 Jul 2026)

No Dividend history available

No Splits history available

No Bonus history available

No Rights history available
Quality key factors
Valuation key factors
Technicals key factors
 Technical Indicator Scale: Bearish, Mildly Bearish, Sideways, Mildly Bullish, Bullish Turned
 Shareholding Snapshot : Jun 2026
Shareholding Compare (%holding)
Non Institution
None
Held by 0 Schemes
Held by 5 FIIs (15.33%)
Sachin Agarwal (17.36%)
Antara India Evergreen Fund Ltd (6.57%)
21.56%
Quarterly Results Snapshot (Consolidated) - Jun'26 - YoY

YoY Growth in quarter ended Jun 2026 is 27.60% vs 61.86% in Jun 2025
YoY Growth in quarter ended Jun 2026 is 12.02% vs 218.83% in Jun 2025
Half Yearly Results Snapshot (Consolidated) - Sep'25

Growth in half year ended Sep 2025 is 63.53% vs 17.23% in Sep 2024
Growth in half year ended Sep 2025 is 237.83% vs -281.43% in Sep 2024
Nine Monthly Results Snapshot (Consolidated) - Dec'25
YoY Growth in nine months ended Dec 2025 is 59.51% vs 24.37% in Dec 2024
YoY Growth in nine months ended Dec 2025 is 477.03% vs -12.98% in Dec 2024
Annual Results Snapshot (Consolidated) - Mar'26
YoY Growth in year ended Mar 2026 is 46.28% vs 36.47% in Mar 2025
YoY Growth in year ended Mar 2026 is 70.35% vs 557.47% in Mar 2025
About Sampann Utpadan India Ltd

Company Coordinates


