NESCO

  • Market Cap: Small Cap
  • Industry: Diversified Commercial Services
  • ISIN: INE317F01035
  • NSEID: NESCO
  • BSEID: 505355
INR
1,025.40
-42.35 (-3.97%)
BSENSE

Mar 13

BSE+NSE Vol: 75.67 k

  • Price Points
  • Score
  • Mojo Parameters
  • Total Return
  • News and Corporate Actions
  • Key factors
  • Shareholding
  • Financials
  • CompanyCV
stock-summaryPrice Point
High/Low

1Day

52 Week

Valuation
Technical
Day's Volume

CASH

75.67 k (77.91%) Volume

Shareholding (Dec 2025)

FII

4.65%

Held by 150 FIIs

DII

0.33%

Held by 5 DIIs

Promoter

68.54%

how big is NESCO?

06-Jun-2025

As of Jun 06, NESCO Ltd has a market capitalization of 6,646.49 Cr, with recent net sales of 765.28 Cr and net profit of 397.42 Cr over the last four quarters. Shareholder's funds are 1,964.59 Cr, and total assets amount to 2,262.68 Cr as of Mar'23.

Market Cap: As of Jun 06, NESCO Ltd has a market capitalization of 6,646.49 Cr, classifying it as a Mid Cap company.<BR><BR>Recent Quarterly Performance: For the latest 4 quarters, NESCO Ltd reported a sum of Net Sales of 765.28 Cr and a sum of Net Profit of 397.42 Cr. This data is on a Consolidated basis.<BR><BR>Balance Sheet Snapshot: The Balance Sheet data is also on a Consolidated basis for the latest annual period ending in Mar'23. Shareholder's Funds are reported at 1,964.59 Cr, and Total Assets amount to 2,262.68 Cr.

View full answer

What does NESCO do?

06-Jun-2025

NESCO Ltd, a diversified mid-cap company founded in 1946, operates in the Diversified Commercial Services industry, reporting net sales of 192 Cr and a net profit of 89 Cr for the quarter ending March 2025. Key metrics include a P/E ratio of 16.00 and a market cap of Rs 6,638 Cr.

Overview: <BR>NESCO Ltd is a diversified company operating in the Diversified Commercial Services industry and classified as a Mid Cap.<BR><BR>History: <BR>NESCO Ltd was incorporated on 15 April, 1946, originally as New Standard Engineering Company Limited. The company underwent a name change in January 2001 to reflect its transformation into a diversified entity. The latest quarterly results reported net sales and net profit for the period ending March 2025.<BR><BR>Financial Snapshot: <BR>Net Sales: 192 Cr (Quarterly Results - Mar 2025) <BR>Net Profit: 89 Cr (Quarterly Results - Mar 2025) <BR>Market Cap: Rs 6,638 Cr (Mid Cap)<BR><BR>Key Metrics: <BR>P/E: 16.00 <BR>Industry P/E: 40 <BR>Dividend Yield: 0.65% <BR>Debt Equity: -0.10 <BR>Return on Equity: 15.11% <BR>Price to Book: 2.49 <BR><BR>Contact Details: <BR>Address: Nesco Complex Western Exp High, Goregaon (East) Mumbai Maharashtra : 400063 <BR>Tel: 91-22-66450123 <BR>Fax: 91-22-66450101 <BR>Email: companysecretary@nesco.in <BR>Website: http://www.nesco.in

View full answer

What is the bonus history of the NESCO?

06-Jun-2025

NESCO Ltd has issued bonus shares twice in its history, with the most recent being a 1:1 bonus on July 20, 2010, and a previous 1:1 bonus on September 4, 2006, demonstrating a consistent practice of rewarding shareholders.

NESCO Ltd has a history of bonus issues, with two notable occurrences. The most recent bonus was a 1:1 issue announced with an ex-date of July 20, 2010, and a record date of July 21, 2010. Prior to that, there was another 1:1 bonus issue with an ex-date of September 4, 2006, and a record date of September 5, 2006. This indicates that NESCO has consistently provided its shareholders with bonus shares in the past.

View full answer

Has NESCO declared dividend?

06-Jun-2025

NESCO Ltd has declared a 300% dividend, amounting to ₹6 per share, with an ex-date of July 26, 2024. While the last 6 months showed a price decline of 8.88%, longer-term returns over 1 to 5 years indicate strong growth, particularly in price returns.

NESCO Ltd has declared a 300% dividend.<BR><BR>Dividend Details:<BR>- Percentage announced: 300%<BR>- Amount per share: 6<BR>- Ex-date: 26 Jul 24<BR><BR>Dividend Yield: 0.65%<BR><BR>Total Returns by Period:<BR>In the last 6 months, the price return was -8.88%, with a dividend return of 0%, resulting in a total return of -8.88%.<BR><BR>Over the past year, there was a price return of 7.55% and a dividend return of 0.67%, leading to a total return of 8.22%.<BR><BR>In the 2-year period, the price return was 47.46% and the dividend return was 1.65%, culminating in a total return of 49.11%.<BR><BR>For the 3-year period, the price return stood at 78.39% with a dividend return of 2.58%, resulting in a total return of 80.97%.<BR><BR>In the last 4 years, the price return was 72.75% and the dividend return was 2.69%, giving a total return of 75.44%.<BR><BR>Finally, over the past 5 years, the price return reached 104.86% with a dividend return of 3.78%, leading to a total return of 108.64%.<BR><BR>Overall, NESCO Ltd has declared a significant dividend, and while the recent 6-month performance shows a decline, the longer-term returns over 1 to 5 years indicate strong growth, particularly in price returns.

View full answer

Who are the peers of the NESCO?

03-Jun-2025

NESCO's peers include International Ge, CMS Info Systems, SIS, AWFIS Space, Quess Corp, Nirlon, Hemisphere Prop., Team Lease Serv., and Updater Services. NESCO has average management risk and a 1-year return of 7.35%, which is better than Hemisphere Prop. but lower than AWFIS Space's 62.85%.

Peers: The peers of NESCO are International Ge, CMS Info Systems, SIS, AWFIS Space, Quess Corp, Nirlon, Hemisphere Prop., Team Lease Serv., and Updater Services.<BR><BR>Quality Snapshot: Excellent management risk is observed at International Ge and CMS Info Systems, while Good management risk is found at Quess Corp and Nirlon. Average management risk is present at NESCO, SIS, Team Lease Serv., and Updater Services, and Below Average management risk is noted at AWFIS Space and Hemisphere Prop. Growth is Excellent at AWFIS Space, Average at Nirlon, and Below Average at NESCO, CMS Info Systems, SIS, Quess Corp, Hemisphere Prop., Team Lease Serv., and Updater Services. Capital Structure is Excellent at International Ge, CMS Info Systems, NESCO, Team Lease Serv., and Updater Services, Good at SIS and Quess Corp, and Below Average at Nirlon, AWFIS Space, and Hemisphere Prop.<BR><BR>Return Snapshot: AWFIS Space has the highest 1-year return at 62.85%, while Hemisphere Prop. has the lowest at -32.10%. NESCO's 1-year return of 7.35% is better than Hemisphere Prop. but lower than AWFIS Space. Additionally, the peers with negative six-month returns include SIS, Quess Corp, Hemisphere Prop., Team Lease Serv., Updater Services, and Texmaco Infrast.

View full answer

Who are in the management team of NESCO?

16-Jul-2025

As of March 2023, NESCO's management team includes Krishna S Patel (Chairman & Managing Director), Sudha S Patel (Non-Executive Director), and several Independent Directors, including K S Srinivasa Murty, Mahendra K Chouhan, Jai Diwanji, Manu Parpia, Amrita Chowdhury, and Manish Ishwarlal Panchal, along with Company Secretary Jinal Jitendra Shah and Ramakrishnan Ramamurthi. Each member plays a key role in the company's governance and strategic direction.

As of March 2023, the management team of NESCO includes the following individuals:<BR><BR>1. K S Srinivasa Murty - Independent Director<BR>2. Mahendra K Chouhan - Independent Director<BR>3. Sudha S Patel - Non-Executive & Non-Independent Director<BR>4. Krishna S Patel - Chairman & Managing Director<BR>5. Jai Diwanji - Independent Director<BR>6. Jinal Jitendra Shah - Company Secretary & Compliance Officer<BR>7. Manu Parpia - Independent Director<BR>8. Amrita Chowdhury - Independent Director<BR>9. Manish Ishwarlal Panchal - Independent Director<BR>10. Ramakrishnan Ramamurthi - Independent Director<BR><BR>Each member holds a significant role within the organization, contributing to its governance and strategic direction.

View full answer

Who are the top shareholders of the NESCO?

17-Jul-2025

The top shareholders of NESCO include Chandler & Price (i) Pvt Ltd with 27.8%, 10 mutual fund schemes with 1.98%, 143 foreign institutional investors holding 4.9%, and individual investors at 17.5%. There are no significant public shareholders.

The top shareholders of NESCO include the promoters, who hold the majority of the shares. The promoter with the highest holding is Chandler & Price (i) Pvt Ltd, which owns 27.8% of the company. Additionally, there are 10 mutual fund schemes that collectively hold 1.98% of the shares, and 143 foreign institutional investors (FIIs) who hold 4.9%. Individual investors account for 17.5% of the holdings. There are no public shareholders with significant holdings noted.

View full answer

Is NESCO technically bullish or bearish?

30-Sep-2025

As of 29 September 2025, NESCO's trend is mildly bullish due to daily moving averages and weekly Bollinger Bands, though tempered by mildly bearish weekly MACD and Dow Theory, while monthly indicators remain bullish, indicating mixed signals overall.

As of 29 September 2025, the technical trend for NESCO has changed from bullish to mildly bullish. The current stance is mildly bullish, primarily driven by the daily moving averages indicating mild bullishness and the weekly Bollinger Bands also showing a mildly bullish signal. However, the weekly MACD and Dow Theory are mildly bearish, which tempers the overall bullish outlook. The monthly indicators, including MACD and Dow Theory, remain bullish, suggesting potential for recovery. Overall, the strength of the bullish stance is moderate, influenced by mixed signals across different time frames.

View full answer

How has been the historical performance of NESCO?

17-Nov-2025

NESCO's historical performance shows a decline in net sales and profits from March 2024 to March 2025, with net sales dropping from 678.18 Cr to 539.90 Cr and profit after tax decreasing from 362.78 Cr to 269.40 Cr, despite an increase in total reserves and assets. Overall, the company faces challenges in revenue and profit generation while strengthening its balance sheet.

Answer:<BR>The historical performance of NESCO shows a fluctuating trend in net sales and profits over the years, with a notable decline in recent periods.<BR><BR>Breakdown:<BR>NESCO's net sales peaked at 678.18 Cr in March 2024 but fell to 539.90 Cr by March 2025. The total operating income followed a similar trend, decreasing from 678.18 Cr in March 2024 to 539.90 Cr in March 2025. The operating profit (PBDIT) also saw a decline, dropping from 531.20 Cr in March 2024 to 398.74 Cr in March 2025, while profit before tax decreased from 462.99 Cr to 354.16 Cr in the same period. Profit after tax followed suit, declining from 362.78 Cr to 269.40 Cr. Despite these declines, the company's total reserves increased significantly from 2,282.41 Cr in March 2024 to 2,615.34 Cr in March 2025, indicating a strengthening balance sheet. Total assets rose from 2,650.32 Cr to 3,015.61 Cr, while total liabilities also increased from 2,650.32 Cr to 3,015.61 Cr, reflecting a consistent growth in the company's financial structure. Cash flow from operating activities decreased from 376.00 Cr to 348.00 Cr, and the net cash outflow was recorded at -8.00 Cr in March 2025, down from a positive inflow of 10.00 Cr in March 2024. Overall, while NESCO has shown growth in reserves and assets, its recent performance indicates challenges in revenue and profit generation.

View full answer

When is the next results date for NESCO Ltd?

20-Jan-2026

The next results date for NESCO Ltd is 27 January 2026.

The next results date for NESCO Ltd is scheduled for 27 January 2026.

View full answer

Are NESCO Ltd latest results good or bad?

28-Jan-2026

NESCO Ltd's latest Q3 FY26 results show strong revenue growth at ₹247.92 crores, but net profit fell by 12% quarter-on-quarter and margins declined significantly, indicating operational challenges and raising concerns about sustainability. Investors should be cautious due to these issues.

NESCO Ltd's latest results for Q3 FY26 present a mixed picture, leaning towards the negative side. While the company achieved its highest quarterly revenue ever at ₹247.92 crores, reflecting a 3.65% increase quarter-on-quarter and a robust 20.03% growth year-on-year, this growth has not translated into profitability. The net profit fell by 12.00% quarter-on-quarter and 4.82% year-on-year to ₹104.64 crores, indicating a concerning trend.<BR><BR>The operating margin, which is a critical measure of profitability, also saw a significant decline, dropping to 50.82% from 56.91% in the previous quarter. This 609 basis point contraction suggests that the company is facing operational challenges, possibly due to rising costs or pricing pressures.<BR><BR>Furthermore, the profit after tax margin decreased to 42.21%, down 751 basis points from the previous quarter, highlighting the deterioration in operational efficiency. The increase in interest expenses by 42.65% sequentially to ₹7.76 crores adds to the financial strain, raising concerns about the company's cost structure and capital management.<BR><BR>Overall, while NESCO's revenue growth is commendable, the decline in net profit and margins raises significant questions about the sustainability of its business model and its ability to generate shareholder value in the current environment. Investors should approach with caution, given the operational challenges and the need for management to address these issues effectively.

View full answer

Should I buy, sell or hold NESCO Ltd?

02-Feb-2026

Why is NESCO Ltd falling/rising?

11-Mar-2026

As of 11-Mar, NESCO Ltd's stock price is at 1,063.60, down 1.68%, and trading below all key moving averages, indicating a bearish trend. The stock has seen a significant decline in investor interest and has underperformed over various time frames, leading to concerns about its long-term growth potential and a strong sell recommendation.

As of 11-Mar, NESCO Ltd's stock price is falling, currently at 1,063.60, reflecting a decrease of 18.2 points or 1.68%. The stock has underperformed the sector by 0.88% today and is trading below its 5-day, 20-day, 50-day, 100-day, and 200-day moving averages, indicating a bearish trend. Additionally, there has been a significant decline in investor participation, with delivery volume dropping by 57.5% compared to the 5-day average, suggesting reduced interest from investors.<BR><BR>Over the past week, the stock has decreased by 1.00%, and it has experienced a more substantial decline of 12.30% over the past month. Year-to-date, the stock is down 13.29%, although it has shown a positive return of 16.25% over the last year. Despite this annual gain, the company's operating profit growth has been relatively low, with an annual growth rate of only 18.40% over the last five years, contributing to concerns about its long-term growth potential.<BR><BR>Furthermore, the company's financial metrics indicate challenges, such as a low return on capital employed (ROCE) of 18.35% and a high price-to-book value ratio of 2.7, which suggests that the stock is trading at a premium compared to its peers. These factors, combined with the recent negative results and a high PEG ratio of 4.3, contribute to the perception that NESCO Ltd is a strong sell, further pressuring the stock price downward.

View full answer

Why is NESCO Ltd falling/rising?

12-Mar-2026

As of 12-Mar, NESCO Ltd's stock price is currently 1,061.90, down 0.62%, and has been on a downward trend, underperforming the Sensex with a year-to-date decline of 13.43%. The stock shows bearish momentum, reduced investor interest, and poor long-term growth indicators.

As of 12-Mar, NESCO Ltd's stock price is falling, currently at 1,061.90, reflecting a decrease of 6.6 points or 0.62%. The stock has been on a downward trend, having lost 1.84% over the last two days and is trading below its 5-day, 20-day, 50-day, 100-day, and 200-day moving averages, indicating a bearish momentum. <BR><BR>In the past week, the stock has underperformed the benchmark Sensex, with a decline of 3.97% compared to the Sensex's 4.98% drop. Over the past month, NESCO Ltd has experienced a significant decline of 12.40%, which is more than the Sensex's 9.13% decrease. Year-to-date, the stock is down 13.43%, while the Sensex has only fallen by 10.78%. <BR><BR>Additionally, there has been a notable decrease in investor participation, with delivery volume dropping by 23.95% against the 5-day average, which suggests reduced interest from investors. The stock's liquidity remains adequate for trading, but the overall sentiment appears negative, compounded by poor long-term growth indicators and a high valuation compared to its peers. <BR><BR>These factors collectively contribute to the stock's current decline, reflecting a challenging environment for NESCO Ltd despite its historical performance over the past year and three years.

View full answer
iScoreScore
Click here to find our call on this stock
Strong Sell
Sell
Hold
Buy
Strong Buy

Dashboard

1

Poor long term growth as Operating profit has grown by an annual rate 18.40% of over the last 5 years

 
2

Negative results in Dec 25

3

With ROE of 14.8, it has a Very Expensive valuation with a 2.6 Price to Book Value

stock-summaryMojo Parameters

Mojo Parameters

Loading Valuation Snapshot...

Stock DNA

stock-summary
Industry

Diversified Commercial Services

stock-summary
Market cap

INR 7,431 Cr (Small Cap)

stock-summary
P/E

18.00

stock-summary
Industry P/E

36

stock-summary
Dividend Yield

0.61%

stock-summary
Debt Equity

-0.06

stock-summary
Return on Equity

14.78%

stock-summary
Price to Book

2.67

Revenue and Profits:
Net Sales:
248 Cr
(Quarterly Results - Dec 2025)
Net Profit:
105 Cr
stock-summaryTotal Returns
Total Returns (Price + Dividend) stock-summary
Dividend Yield (0.61%)
TimePeriod
Price Return
Dividend Return
Total Return
3 Months
-17.58%
0%
-17.58%
6 Months
-33.46%
0%
-33.46%
1 Year
16.26%
0.72%
16.98%
2 Years
33.83%
1.53%
35.36%
3 Years
97.67%
3.29%
100.96%
4 Years
87.19%
3.32%
90.51%
5 Years
78.01%
4.44%
82.45%

Latest dividend: 6.5 per share ex-dividend date: Jul-23-2025

Risk Adjusted Returns v/s stock-summary
Returns Beta
Icon
Beta has not been calculated since enough price history is not available
stock-summaryNews & Corporate Actions

News

Why is NESCO Ltd falling/rising?

Recent Price Movement and Market Context

NESCO Ltd closed at ₹1,025.40, down ₹42.35 or 3.97% on 13-Mar, marking the third consecutive day of decline. Over the past week, the stock has lost 5.59%, slightly underperforming the Sensex’s 5.52% fall. The one-month performance is more pronounced, with NESCO declining 13.48% compared to the Sensex’s 9.76% drop. Year-to-date, the stock has fallen 16.40%, underperforming the benchmark’s 12.50% loss. These figures indicate that NESCO is experiencing sharper short-term pressure than the broader market.

Intraday trading on 13-Mar saw the stock touch a low of ₹1,012.60, down 5.17%, with heavier volume traded near this lower price point. This suggests selling pressure dominated the session. Additionally, NESCO is trading below all k...

Read full news article
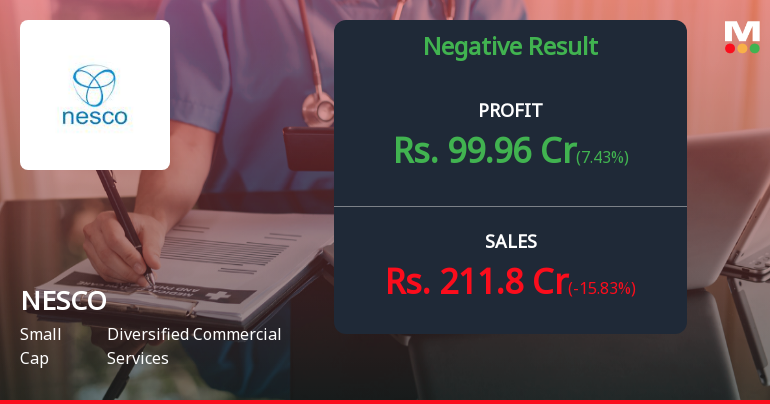
Announcements stock-summary

Re-Lodgement Of Transfer Requests Of Physical Shares- Monthly Updates.

10-Feb-2026 | Source : BSE

Re-lodgement of Transfer Requests of Physical Shares- Monthly Updates.

Intimation Of Opening Of Special Window For Transfer And Dematerialisation Of Physical Securities.

03-Feb-2026 | Source : BSE

Intimation of opening of special window for transfer and dematerialisation of physical securities.

Announcement under Regulation 30 (LODR)-Newspaper Publication

29-Jan-2026 | Source : BSE

copy of Newspaper Publication.

Corporate Actions stock-summary

stock-summary
BOARD MEETING

No Upcoming Board Meetings

stock-summary
DIVIDEND

NESCO Ltd has declared 325% dividend, ex-date: 23 Jul 25

stock-summary
SPLITS

NESCO Ltd has announced 2:10 stock split, ex-date: 15 Sep 17

stock-summary
BONUS

NESCO Ltd has announced 1:1 bonus issue, ex-date: 20 Jul 10

stock-summary
RIGHTS

No Rights history available

stock-summaryKey Factors

Quality key factors stock-summary

Factor
Value
Sales Growth (5y)
21.19%
EBIT Growth (5y)
18.40%
EBIT to Interest (avg)
24.41
Debt to EBITDA (avg)
0.12
Net Debt to Equity (avg)
-0.06
Sales to Capital Employed (avg)
0.28
Tax Ratio
20.09%
Dividend Payout Ratio
10.91%
Pledged Shares
0
Institutional Holding
8.44%
ROCE (avg)
16.39%
ROE (avg)
14.09%

Valuation key factors

Factor
Value
P/E Ratio
18
Industry P/E
36
Price to Book Value
2.58
EV to EBIT
16.38
EV to EBITDA
14.72
EV to Capital Employed
2.69
EV to Sales
8.08
PEG Ratio
4.18
Dividend Yield
0.63%
ROCE (Latest)
16.38%
ROE (Latest)
14.78%

Technicals key factors

Indicator
Weekly
Monthly
MACD
Bearish
Mildly Bearish
RSI
No Signal
No Signal
Bollinger Bands
Bearish
Bearish
Moving Averages
Bearish (Daily)
KST
Bearish
Bullish
Dow Theory
Mildly Bearish
Mildly Bearish
OBV
Mildly Bearish
Mildly Bearish
stock-summary Technical Indicator Scale: Bearish, Mildly Bearish, Sideways, Mildly Bullish, Bullish  Turned 
stock-summaryShareholding
Shareholding Snapshot : Dec 2025stock-summary
Shareholding Compare (%holding) stock-summary
Majority shareholders

Promoters

Pledged Promoter Holdings

None

Mutual Funds

Held by 11 Schemes (2.79%)

FIIs

Held by 150 FIIs (4.65%)

Promoter with highest holding

Chandler & Price (i) Pvt Ltd (27.8%)

Highest Public shareholder

Hsbc Mutual Fund - Hsbc Small Cap Fund (1.3%)

Individual Investors Holdings

16.99%

stock-summaryFinancial
[
  {
    "link": "quarterly",
    "btn_text": "All Quarterly Results",
    "header": "Quarterly Results Snapshot (Consolidated) - Dec'25 - QoQ",
    "rhs": [
      {
        "prefix": "Net Sales ",
        "suffix": "QoQ Growth in quarter ended Dec 2025 is 3.65% vs 23.71% in Sep 2025",
        "dir": -1
      },
      {
        "prefix": "Consolidated Net Profit ",
        "suffix": "QoQ Growth in quarter ended Dec 2025 is -12.00% vs 23.68% in Sep 2025",
        "dir": -1
      }
    ],
    "table": {
      "header": [
        "Dec'25",
        "Sep'25",
        "Change(%)"
      ],
      "body": [
        {
          "field": "Net Sales",
          "val1": "247.92",
          "val2": "239.18",
          "chgp": "3.65%",
          "chgp_class": "positive"
        },
        {
          "field": "Operating Profit (PBDIT) excl Other Income",
          "val1": "125.99",
          "val2": "136.12",
          "chgp": "-7.44%",
          "chgp_class": "negative"
        },
        {
          "field": "Interest",
          "val1": "7.76",
          "val2": "5.44",
          "chgp": "42.65%",
          "chgp_class": "negative"
        },
        {
          "field": "Exceptional Items",
          "val1": "0.00",
          "val2": "0.00",
          "chgp": "",
          "chgp_class": "neutral"
        },
        {
          "field": "Consolidate Net Profit",
          "val1": "104.64",
          "val2": "118.91",
          "chgp": "-12.00%",
          "chgp_class": "negative"
        },
        {
          "field": "Operating Profit Margin (Excl OI)",
          "val1": "50.82%",
          "val2": "56.91%",
          "chgp": "-6.09%",
          "chgp_class": "negative"
        }
      ]
    }
  },
  {
    "link": "half-yearly",
    "btn_text": "All Half Yearly Results",
    "alert": "No Half Yearly Results declared by NESCO"
  },
  {
    "link": "nine-monthly",
    "btn_text": "All Nine Monthly Results",
    "alert": "No Nine Monthly Results declared by NESCO"
  },
  {
    "link": "annual",
    "btn_text": "All Annual Results",
    "header": "Annual Results Snapshot (Consolidated) - Mar'25",
    "rhs": [
      {
        "prefix": "Net Sales ",
        "suffix": "YoY Growth in year ended Mar 2025 is 7.94% vs 24.21% in Mar 2024",
        "dir": -1
      },
      {
        "prefix": "Consolidated Net Profit ",
        "suffix": "YoY Growth in year ended Mar 2025 is 3.43% vs 24.82% in Mar 2024",
        "dir": -1
      }
    ],
    "table": {
      "header": [
        "Mar'25",
        "Mar'24",
        "Change(%)"
      ],
      "body": [
        {
          "field": "Net Sales",
          "val1": "732.01",
          "val2": "678.18",
          "chgp": "7.94%",
          "chgp_class": "positive"
        },
        {
          "field": "Operating Profit (PBDIT) excl Other Income",
          "val1": "444.45",
          "val2": "431.35",
          "chgp": "3.04%",
          "chgp_class": "positive"
        },
        {
          "field": "Interest",
          "val1": "12.32",
          "val2": "14.05",
          "chgp": "-12.31%",
          "chgp_class": "positive"
        },
        {
          "field": "Exceptional Items",
          "val1": "3.45",
          "val2": "0.42",
          "chgp": "721.43%",
          "chgp_class": "positive"
        },
        {
          "field": "Consolidate Net Profit",
          "val1": "375.21",
          "val2": "362.78",
          "chgp": "3.43%",
          "chgp_class": "positive"
        },
        {
          "field": "Operating Profit Margin (Excl OI)",
          "val1": "53.90%",
          "val2": "55.62%",
          "chgp": "-1.72%",
          "chgp_class": "negative"
        }
      ]
    }
  }
]

Quarterly Results Snapshot (Consolidated) - Dec'25 - QoQstock-summary

Dec'25
Sep'25
Change(%)
Net Sales
247.92
239.18
3.65%
Operating Profit (PBDIT) excl Other Income
125.99
136.12
-7.44%
Interest
7.76
5.44
42.65%
Exceptional Items
0.00
0.00
Consolidate Net Profit
104.64
118.91
-12.00%
Operating Profit Margin (Excl OI)
50.82%
56.91%
-6.09%
Values in Rs Cr.
Direction Arrows
Net Sales

QoQ Growth in quarter ended Dec 2025 is 3.65% vs 23.71% in Sep 2025

Direction Arrows
Consolidated Net Profit

QoQ Growth in quarter ended Dec 2025 is -12.00% vs 23.68% in Sep 2025

Annual Results Snapshot (Consolidated) - Mar'25stock-summary

Mar'25
Mar'24
Change(%)
Net Sales
732.01
678.18
7.94%
Operating Profit (PBDIT) excl Other Income
444.45
431.35
3.04%
Interest
12.32
14.05
-12.31%
Exceptional Items
3.45
0.42
721.43%
Consolidate Net Profit
375.21
362.78
3.43%
Operating Profit Margin (Excl OI)
53.90%
55.62%
-1.72%
Values in Rs Cr.
Direction Arrows
Net Sales

YoY Growth in year ended Mar 2025 is 7.94% vs 24.21% in Mar 2024

Direction Arrows
Consolidated Net Profit

YoY Growth in year ended Mar 2025 is 3.43% vs 24.82% in Mar 2024

stock-summaryCompany CV
About NESCO Ltd stock-summary
stock-summary
NESCO Ltd
Small Cap
Diversified Commercial Services
Nesco Limited, formerly known New Standard Engineering Company Limited was incorporated on 15 April, 1946. In order to reflect the company's transformation from engineering company to a diversified company, the name of the Company was changed from New Standard Engineering Company Limited to Nesco Limited in January, 2001. Nesco is a diversified Company in four business segments. Nesco IT Park provides space to some of the world's leading companies.
Company Coordinates stock-summary
Company Details
Nesco Complex Western Exp High, Goregaon (East) Mumbai Maharashtra : 400063
stock-summary
Tel: 91-22-66450123
stock-summary
companysecretary@nesco.in
Registrar Details
Sharex Dynamic (India) Pvt Ltd , Unit -1, Luthra Ind. Premises , Safed Pool, Andheri-Kurla Road, Andheri (E), Mumbai