
Compare Vadilal Enterp. with Similar Stocks
Total Returns (Price + Dividend) 
Latest dividend: 1.5 per share ex-dividend date: Sep-16-2025
Risk Adjusted Returns v/s
Returns Beta

News

Vadilal Enterprises Ltd is Rated Sell
Vadilal Enterprises Ltd is rated 'Sell' by MarketsMOJO, with this rating last updated on 17 Nov 2025. However, the analysis and financial metrics discussed here reflect the stock's current position as of 15 June 2026, providing investors with an up-to-date view of the company’s fundamentals, valuation, financial trend, and technical outlook.
Read full news article
Vadilal Enterprises Ltd Faces Mildly Bearish Momentum Amid Technical Shifts
Vadilal Enterprises Ltd, a micro-cap player in the FMCG sector, has experienced a notable shift in its technical momentum, transitioning from a sideways trend to a mildly bearish stance. Recent technical indicators reveal a complex interplay of bullish and bearish signals, prompting a downgrade in its Mojo Grade from Hold to Sell as of 17 Nov 2025. This article analyses the evolving price momentum, key technical indicators, and the stock’s comparative performance against the Sensex.
Read full news article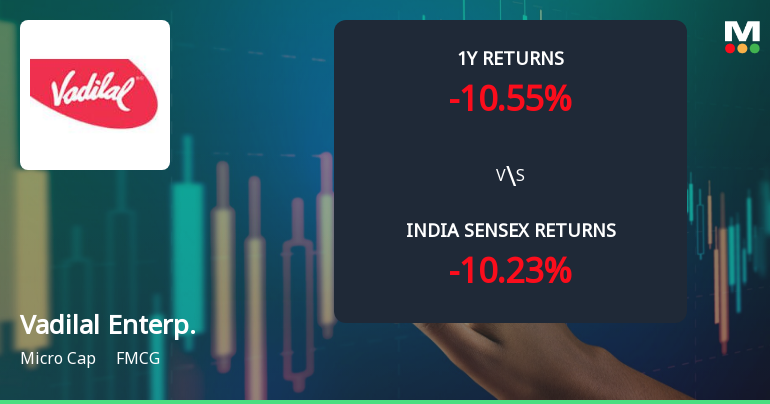
Vadilal Enterprises Ltd Technical Momentum Shifts Amid Mixed Indicators
Vadilal Enterprises Ltd, a micro-cap player in the FMCG sector, has experienced a notable shift in its technical momentum, moving from a mildly bearish stance to a sideways trend. Despite a recent upgrade in its technical outlook, the company’s MarketsMOJO score has declined to 42.0, resulting in a downgrade from Hold to Sell as of 17 Nov 2025. This article analyses the latest price momentum, key technical indicators, and the implications for investors amid a mixed market backdrop.
Read full news article Announcements
Board Meeting Outcome for Outcome Of The Board Meeting Held On 29Th May 2026.
29-May-2026 | Source : BSERegulation 30 (read with Schedule III - Part A) of the Securities and Exchange Board of India (Listing Obligations and Disclosure Requirements) Regulations 2015.
General - Update
29-May-2026 | Source : BSEStructured Digital Database (SDD) Compliance Certificate for the year ended March 2026
Board Meeting Intimation for The Date Of Board Meeting Under Regulation 29 Of The SEBI (Listing Obligations And Disclosure Requirements) Regulations 2015
22-May-2026 | Source : BSEVadilal Enterprises Ltdhas informed BSE that the meeting of the Board of Directors of the Company is scheduled on 29/05/2026 inter alia to consider and approve 1.To consider and approve the Annual Audited Standalone Results of the Company under Indian Accounting Standards (Ind AS) for the quarter/year ended on 31st March 2026. 2. To recommend dividend if any on 862668 Equity Shares of Rs. 10/- each of the Company for the FY 2025-26.
Corporate Actions

No Upcoming Board Meetings

Vadilal Enterprises Ltd has declared 15% dividend, ex-date: 16 Sep 25

No Splits history available

No Bonus history available

No Rights history available
Quality key factors
Valuation key factors
Technicals key factors
 Technical Indicator Scale: Bearish, Mildly Bearish, Sideways, Mildly Bullish, Bullish Turned
 Shareholding Snapshot : Mar 2026
Shareholding Compare (%holding)
Promoters
None
Held by 0 Schemes
Held by 1 FIIs (0.54%)
Devanshu Laxmanbhai Gandhi (13.99%)
Sanjiv Dhireshbhai Shah (6.94%)
35.81%
Quarterly Results Snapshot (Standalone) - Mar'26 - YoY

YoY Growth in quarter ended Mar 2026 is 30.16% vs 18.77% in Mar 2025
YoY Growth in quarter ended Mar 2026 is 51.83% vs -0.57% in Mar 2025
Half Yearly Results Snapshot (Standalone) - Sep'25

Growth in half year ended Sep 2025 is 2.90% vs 11.83% in Sep 2024
Growth in half year ended Sep 2025 is -6.13% vs 134.12% in Sep 2024
Nine Monthly Results Snapshot (Standalone) - Dec'25
YoY Growth in nine months ended Dec 2025 is 3.43% vs 10.44% in Dec 2024
YoY Growth in nine months ended Dec 2025 is 1.24% vs -10.72% in Dec 2024
Annual Results Snapshot (Standalone) - Mar'26
YoY Growth in year ended Mar 2026 is 8.77% vs 12.01% in Mar 2025
YoY Growth in year ended Mar 2026 is 82.37% vs -23.70% in Mar 2025
About Vadilal Enterprises Ltd

Company Coordinates


