
Compare Bombay Oxygen with Similar Stocks
Stock DNA
Non Banking Financial Company (NBFC)
INR 297 Cr (Micro Cap)
NA (Loss Making)
23
0.00%
0.00
-0.69%
0.63
Total Returns (Price + Dividend) 
Latest dividend: 35 per share ex-dividend date: Jul-08-2025
Risk Adjusted Returns v/s
Returns Beta

News
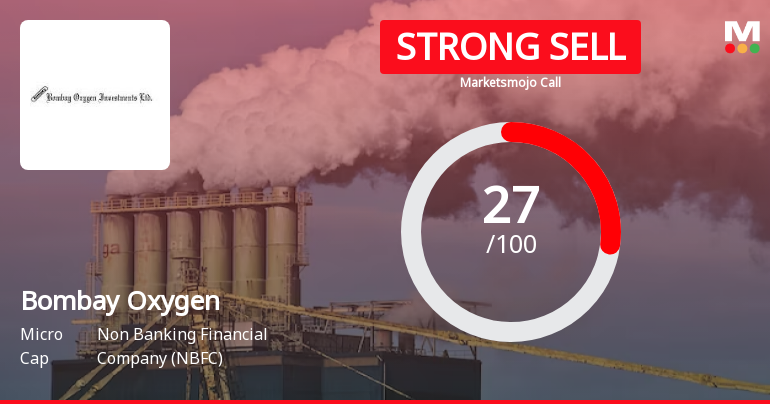
Bombay Oxygen Investments Ltd is Rated Strong Sell
Bombay Oxygen Investments Ltd is rated 'Strong Sell' by MarketsMOJO, with this rating last updated on 27 May 2026. However, the analysis and financial metrics discussed here reflect the stock's current position as of 29 May 2026, providing investors with the latest insights into its performance and outlook.
Read full news article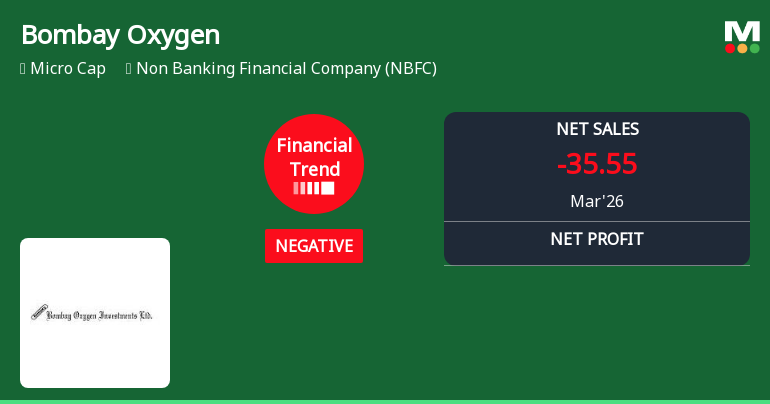
Bombay Oxygen Investments Ltd Reports Sharp Quarterly Decline Amid Negative Financial Trend
Bombay Oxygen Investments Ltd, a micro-cap player in the Non Banking Financial Company (NBFC) sector, has reported a significant deterioration in its financial performance for the quarter ended March 2026. The company’s financial trend has shifted from flat to negative, with key profitability and liquidity metrics plunging sharply, signalling mounting challenges for investors and stakeholders alike.
Read full news article Announcements
Announcement under Regulation 30 (LODR)-Newspaper Publication
16-Jul-2026 | Source : BSEIntimation of Notice Published by way of an advertisement in respect of 65th Annual General Meeting to be held through Video Conference (VC)/ Other Audio-Visual Means (OAVM)
Compliances-Certificate under Reg. 74 (5) of SEBI (DP) Regulations 2018
08-Jul-2026 | Source : BSEPlease find attached certificate under Regulation 74(5) of SEBI (DP) Regulations 2018 for the quarter ended 30th June 2026
Closure of Trading Window
26-Jun-2026 | Source : BSEIntimation with respect to Closure of Trading Window for dealing in the securities of the Company from 1st July 2026 till 48 hours after the declaration of Unaudited Financial Results of the Company for the quarter ending 30th June 2026
Corporate Actions

No Upcoming Board Meetings

Bombay Oxygen Investments Ltd has declared 25% dividend, ex-date: 18 Aug 26

No Splits history available

No Bonus history available

No Rights history available
Quality key factors
Valuation key factors
Technicals key factors
 Technical Indicator Scale: Bearish, Mildly Bearish, Sideways, Mildly Bullish, Bullish Turned
 Shareholding Snapshot : Jun 2026
Shareholding Compare (%holding)
Promoters
None
Held by 0 Schemes
Held by 0 FIIs
M Ramnarain Pvt Ltd. (22.41%)
Shubh Pharma Pvt Ltd (3.75%)
14.63%
Quarterly Results Snapshot (Standalone) - Mar'26 - QoQ

QoQ Growth in quarter ended Mar 2026 is -441.50% vs 282.63% in Dec 2025
QoQ Growth in quarter ended Mar 2026 is -442.90% vs 275.48% in Dec 2025
Half Yearly Results Snapshot (Standalone) - Sep'25
Growth in half year ended Sep 2025 is -56.24% vs 47.71% in Sep 2024
Growth in half year ended Sep 2025 is -58.03% vs 44.10% in Sep 2024
Nine Monthly Results Snapshot (Standalone) - Dec'25

YoY Growth in nine months ended Dec 2025 is -2.44% vs -40.82% in Dec 2024
YoY Growth in nine months ended Dec 2025 is -5.50% vs -39.04% in Dec 2024
Annual Results Snapshot (Standalone) - Mar'26
YoY Growth in year ended Mar 2026 is -109.70% vs -71.47% in Mar 2025
YoY Growth in year ended Mar 2026 is -118.50% vs -69.60% in Mar 2025
About Bombay Oxygen Investments Ltd

Company Coordinates


