
Compare Kuber Udyog with Similar Stocks
Dashboard
Weak Long Term Fundamental Strength with an average Return on Equity (ROE) of 3.43%
Positive results in Mar 26
With ROE of 12.6, it has a Very Attractive valuation with a 1.6 Price to Book Value
Increasing Participation by Institutional Investors
Consistent Returns over the last 3 years
Stock DNA
Non Banking Financial Company (NBFC)
INR 7 Cr (Micro Cap)
13.00
22
0.00%
0.73
12.63%
1.62
Total Returns (Price + Dividend) 
Kuber Udyog for the last several years.
Risk Adjusted Returns v/s
Returns Beta

News
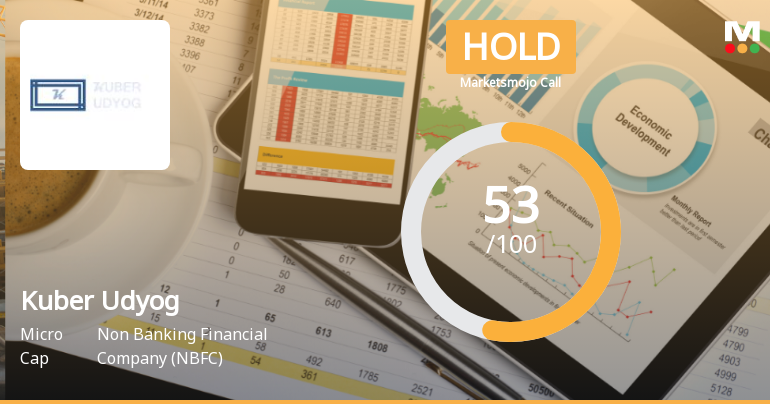
Kuber Udyog Ltd Upgraded to Hold by MarketsMOJO on Improving Technicals and Financials
Kuber Udyog Ltd, a micro-cap player in the Non Banking Financial Company (NBFC) sector, has seen its investment rating upgraded from Sell to Hold as of 13 July 2026. This shift reflects improvements across multiple parameters including technical indicators, valuation metrics, financial performance, and quality assessments. The company’s recent quarterly results, institutional investor interest, and evolving technical trends have collectively contributed to this reassessment by MarketsMOJO, which now assigns it a Mojo Score of 53.0 and a Hold grade.
Read full news article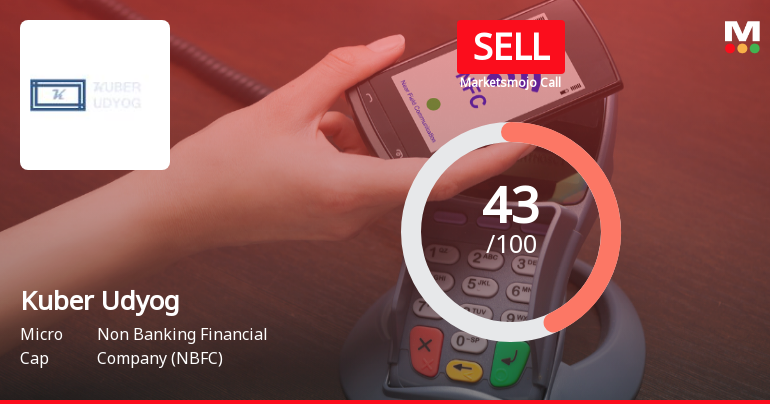
Kuber Udyog Ltd Downgraded to Sell Amid Technical Weakness and Valuation Concerns
Kuber Udyog Ltd, a micro-cap player in the Non Banking Financial Company (NBFC) sector, has seen its investment rating downgraded from Hold to Sell as of 7 July 2026. This shift reflects a complex interplay of deteriorating technical indicators, modest financial trends, valuation considerations, and overall quality assessments, signalling caution for investors amid recent market volatility and underperformance relative to benchmarks.
Read full news article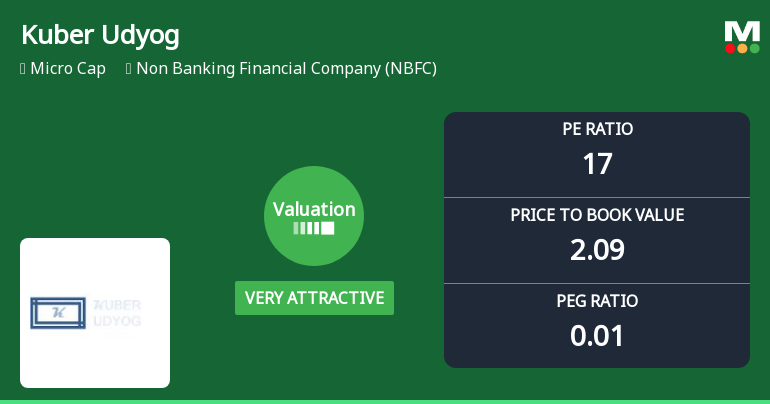
Kuber Udyog Ltd Valuation Shifts Signal Renewed Price Attractiveness
Kuber Udyog Ltd, a micro-cap player in the Non Banking Financial Company (NBFC) sector, has seen a notable shift in its valuation parameters, moving from an attractive to a very attractive grade. This change, driven by improved price-to-earnings (P/E) and price-to-book value (P/BV) ratios relative to its historical averages and peer group, offers investors a compelling case to reassess the stock’s price attractiveness amid broader market and sectoral trends.
Read full news article Announcements
Compliances-Certificate under Reg. 74 (5) of SEBI (DP) Regulations 2018
10-Jul-2026 | Source : BSECertificate under Regulation 74(5) of SEBI (DP) Regulations 2018.
Closure of Trading Window
29-Jun-2026 | Source : BSEIntimation of Closure of Trading Window.
Announcement under Regulation 30 (LODR)-Newspaper Publication
01-Jun-2026 | Source : BSENewspaper Publication of the Audited Financial Results of the Company for the quarter and year ended March 31 2026.
Corporate Actions

No Upcoming Board Meetings

No Dividend history available

No Splits history available

No Bonus history available

No Rights history available
Quality key factors
Valuation key factors
Technicals key factors
 Technical Indicator Scale: Bearish, Mildly Bearish, Sideways, Mildly Bullish, Bullish Turned
 Shareholding Snapshot : Jun 2026
Shareholding Compare (%holding)
Non Institution
None
Held by 0 Schemes
Held by 2 FIIs (14.44%)
Maanzhi Investment & Trading Company Private Limited (0.0%)
Nileshkumar Madhukarbhai Joshi (8.91%)
80.78%
Quarterly Results Snapshot (Standalone) - Mar'26 - QoQ

QoQ Growth in quarter ended Mar 2026 is 450.00% vs 20.00% in Dec 2025
QoQ Growth in quarter ended Mar 2026 is 150.00% vs 100.00% in Dec 2025
Half Yearly Results Snapshot (Standalone) - Sep'25
Growth in half year ended Sep 2025 is 60.00% vs -16.67% in Sep 2024
Growth in half year ended Sep 2025 is 133.33% vs 0.00% in Sep 2024
Nine Monthly Results Snapshot (Standalone) - Dec'25
YoY Growth in nine months ended Dec 2025 is 56.76% vs -19.57% in Dec 2024
YoY Growth in nine months ended Dec 2025 is 300.00% vs -25.00% in Dec 2024
Annual Results Snapshot (Standalone) - Mar'26
YoY Growth in year ended Mar 2026 is 253.49% vs -23.21% in Mar 2025
YoY Growth in year ended Mar 2026 is 1,500.00% vs -70.00% in Mar 2025
About Kuber Udyog Ltd

Company Coordinates


