
Compare SKF India with Similar Stocks
Stock DNA
Industrial Products
INR 7,447 Cr (Small Cap)
24.00
47
2.81%
-0.22
22.55%
5.50
Total Returns (Price + Dividend) 
Latest dividend: 40 per share ex-dividend date: Jul-03-2026
Risk Adjusted Returns v/s
Returns Beta

News
SKF India Ltd is Rated Sell by MarketsMOJO
SKF India Ltd is rated Sell by MarketsMOJO, with this rating last updated on 02 July 2026. However, the analysis and financial metrics discussed below reflect the stock’s current position as of 25 July 2026, providing investors with an up-to-date view of the company’s fundamentals, returns, and market standing.
Read full news article
SKF India Ltd Technical Momentum Shifts Amid Bearish Signals
SKF India Ltd has experienced a notable shift in its technical momentum, with key indicators signalling a transition from a mildly bearish to a more pronounced bearish trend. This change comes amid a 1.43% decline in the stock price to ₹1,458.05, reflecting growing investor caution in the industrial products sector.
Read full news article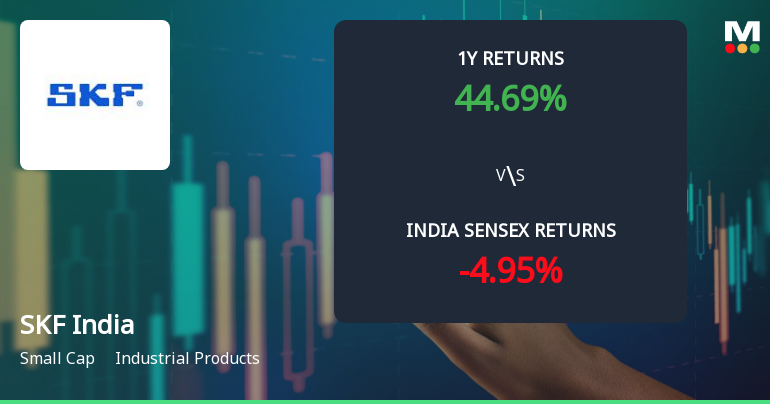
SKF India Ltd Technical Momentum Shifts Amid Mixed Indicator Signals
SKF India Ltd, a small-cap player in the Industrial Products sector, has experienced a nuanced shift in its technical momentum, reflecting a complex interplay of bearish and mildly bullish signals across key indicators. Despite a modest day gain of 0.33%, the stock’s technical parameters reveal a cautious outlook, with recent downgrades and mixed trend assessments suggesting investors should carefully weigh the evolving market dynamics.
Read full news article Announcements
SKF India Limited - Other General Purpose
21-Nov-2019 | Source : NSESKF India Limited has informed the Exchange regarding Disclosure of related party transactions for the half year ended on September 30, 2019.
SKF India Limited - Updates
05-Nov-2019 | Source : NSESKF India Limited has informed the Exchange regarding 'Newspaper Advertisement - Regulation 47 of SEBI (Listing Obligations and Disclosure Requirements) Regulations, 2015'.
SKF India Limited - Outcome of Board Meeting
29-Oct-2019 | Source : NSESKF India Limited has informed the Exchange regarding Board meeting held on October 29, 2019.
Corporate Actions

No Upcoming Board Meetings

SKF India Ltd has declared 400% dividend, ex-date: 03 Jul 26

No Splits history available

No Bonus history available

No Rights history available
Quality key factors
Valuation key factors
Technicals key factors
 Technical Indicator Scale: Bearish, Mildly Bearish, Sideways, Mildly Bullish, Bullish Turned
 Shareholding Snapshot : Jun 2026
Shareholding Compare (%holding)
Promoters
None
Held by 15 Schemes (24.25%)
Held by 129 FIIs (6.89%)
Skf Vertevo Ab (earstwhile Skf Interim Ab) (52.58%)
Hdfc Mutual Fund - Hdfc Mid-cap Fund (9.65%)
10.19%
Quarterly Results Snapshot (Consolidated) - Mar'26 - QoQ

QoQ Growth in quarter ended Mar 2026 is 3.10% vs -55.95% in Dec 2025

QoQ Growth in quarter ended Mar 2026 is -131.87% vs -41.23% in Dec 2025
Half Yearly Results Snapshot (Consolidated) - Sep'25
Growth in half year ended Sep 2025 is 5.79% vs 7.72% in Sep 2024
Growth in half year ended Sep 2025 is -11.62% vs 3.57% in Sep 2024
Nine Monthly Results Snapshot (Consolidated) - Dec'25
YoY Growth in nine months ended Dec 2025 is -14.51% vs 10.09% in Dec 2024
YoY Growth in nine months ended Dec 2025 is -21.21% vs -3.70% in Dec 2024
Annual Results Snapshot (Consolidated) - Mar'26
YoY Growth in year ended Mar 2026 is -23.51% vs 7.65% in Mar 2025
YoY Growth in year ended Mar 2026 is -53.01% vs 2.56% in Mar 2025
About SKF India Ltd

Company Coordinates


