
Compare AvenuesAI with Similar Stocks
Dashboard
Poor Management Efficiency with a low ROE of 4.49%
- The company has been able to generate a Return on Equity (avg) of 4.49% signifying low profitability per unit of shareholders funds
Despite the size of the company, domestic mutual funds hold only 0.24% of the company
Below par performance in long term as well as near term
Stock DNA
Financial Technology (Fintech)
INR 4,960 Cr (Small Cap)
20.00
21
0.00%
-0.18
5.67%
1.18
Total Returns (Price + Dividend) 
Latest dividend: 0.05000000000000001 per share ex-dividend date: Aug-07-2024
Risk Adjusted Returns v/s
Returns Beta

News
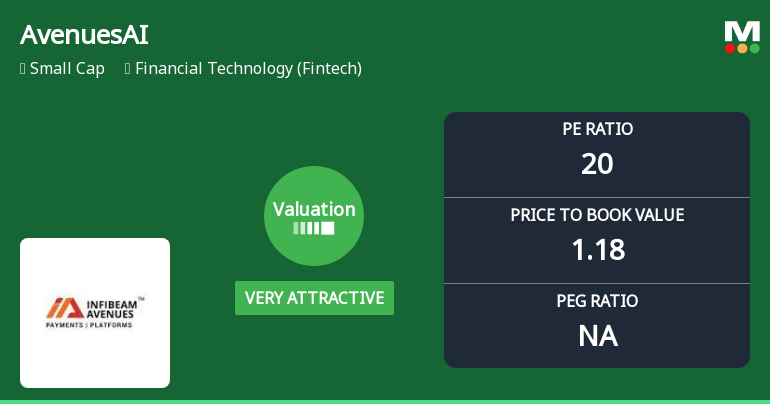
AvenuesAI Ltd Valuation Shifts Signal Renewed Price Attractiveness Amid Market Challenges
AvenuesAI Ltd, a small-cap player in the Financial Technology sector, has seen a notable shift in its valuation parameters, moving from an attractive to a very attractive rating. Despite this positive change in valuation metrics, the stock’s recent returns have lagged behind the broader Sensex, reflecting a complex investment landscape for shareholders and potential investors alike.
Read full news article
AvenuesAI Ltd is Rated Sell
AvenuesAI Ltd is rated 'Sell' by MarketsMOJO, with this rating last updated on 14 Jan 2026. However, the analysis and financial metrics discussed here reflect the stock's current position as of 01 May 2026, providing investors with an up-to-date view of the company’s fundamentals, returns, and market performance.
Read full news article
AvenuesAI Ltd is Rated Sell
AvenuesAI Ltd is rated 'Sell' by MarketsMOJO, with this rating last updated on 14 January 2026. However, the analysis and financial metrics discussed here reflect the stock's current position as of 20 April 2026, providing investors with an up-to-date view of the company’s performance and outlook.
Read full news article Announcements
Infibeam Avenues Limited - Press Release
25-Oct-2019 | Source : NSEInfibeam Avenues Limited has informed the Exchange regarding a press release dated October 25, 2019, titled "Press Release on Unaudited Financial Results for the quarter and half year ended on September 30, 2019".
Infibeam Avenues Limited - Record Date
23-Oct-2019 | Source : NSEInfibeam Avenues Limited has informed the Exchange that the Company has fixed Record Date as November 8, 2019 for the purpose of Payment of Interim Dividend, if declared.
Infibeam Avenues Limited - Analysts/Institutional Investor Meet/Con. Call Updates
22-Oct-2019 | Source : NSEInfibeam Avenues Limited has informed the Exchange regarding Analysts/Institutional Investor Meet/Con. Call Updates
Corporate Actions

No Upcoming Board Meetings

AvenuesAI Ltd has declared 5% dividend, ex-date: 07 Aug 24

AvenuesAI Ltd has announced 1:10 stock split, ex-date: 31 Aug 17

AvenuesAI Ltd has announced 1:1 bonus issue, ex-date: 14 Mar 22

AvenuesAI Ltd has announced 67:267 rights issue, ex-date: 26 Jun 25
Quality key factors
Valuation key factors
Technicals key factors
 Technical Indicator Scale: Bearish, Mildly Bearish, Sideways, Mildly Bullish, Bullish Turned
 Shareholding Snapshot : Mar 2026
Shareholding Compare (%holding)
Non Institution
None
Held by 5 Schemes (0.17%)
Held by 106 FIIs (5.75%)
Vishal Ajitbhai Mehta (8.58%)
Vishwas Ambalal Patel (10.96%)
36.93%
Quarterly Results Snapshot (Consolidated) - Dec'25 - QoQ

QoQ Growth in quarter ended Dec 2025 is 21.19% vs 53.48% in Sep 2025
QoQ Growth in quarter ended Dec 2025 is 8.06% vs 8.60% in Sep 2025
Half Yearly Results Snapshot (Consolidated) - Sep'25

Growth in half year ended Sep 2025 is 84.20% vs 15.37% in Sep 2024
Growth in half year ended Sep 2025 is 12.16% vs 68.26% in Sep 2024
Nine Monthly Results Snapshot (Consolidated) - Dec'25
YoY Growth in nine months ended Dec 2025 is 98.66% vs 16.35% in Dec 2024
YoY Growth in nine months ended Dec 2025 is 13.23% vs 58.20% in Dec 2024
Annual Results Snapshot (Consolidated) - Mar'25
YoY Growth in year ended Mar 2025 is 26.74% vs 60.54% in Mar 2024
YoY Growth in year ended Mar 2025 is 42.61% vs 13.24% in Mar 2024
About AvenuesAI Ltd

Company Coordinates


