
Compare United Polyfab with Similar Stocks
Dashboard
Weak Long Term Fundamental Strength with a 15.47% CAGR growth in Operating Profits over the last 5 years
Flat results in Mar 26
With ROCE of 15.6, it has a Very Expensive valuation with a 3.6 Enterprise value to Capital Employed
Despite the size of the company, domestic mutual funds hold only 0% of the company
Stock DNA
Garments & Apparels
INR 723 Cr (Micro Cap)
29.00
25
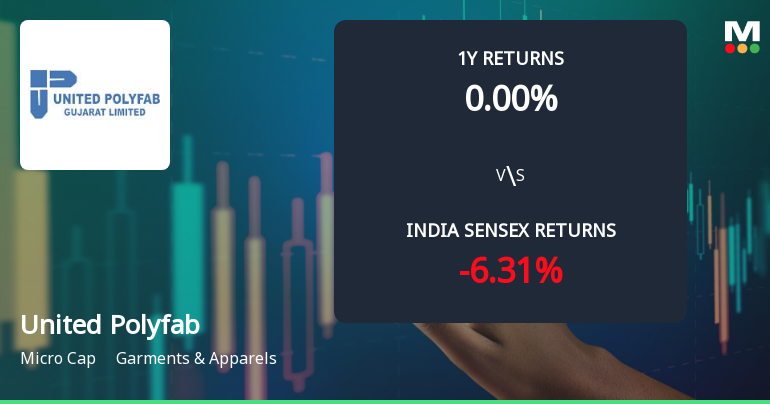
0.00%
0.74
19.20%
5.53
Total Returns (Price + Dividend) 
United Polyfab for the last several years.
Risk Adjusted Returns v/s
Returns Beta

News
United Polyfab Gujarat Ltd Faces Mildly Bearish Momentum Amid Technical Downgrade
United Polyfab Gujarat Ltd, a micro-cap player in the Garments & Apparels sector, has experienced a subtle but notable shift in its technical momentum, moving from a sideways trend to a mildly bearish stance. This transition is underscored by key technical indicators such as MACD, RSI, and moving averages, signalling caution for investors amid a challenging market backdrop.
Read full news article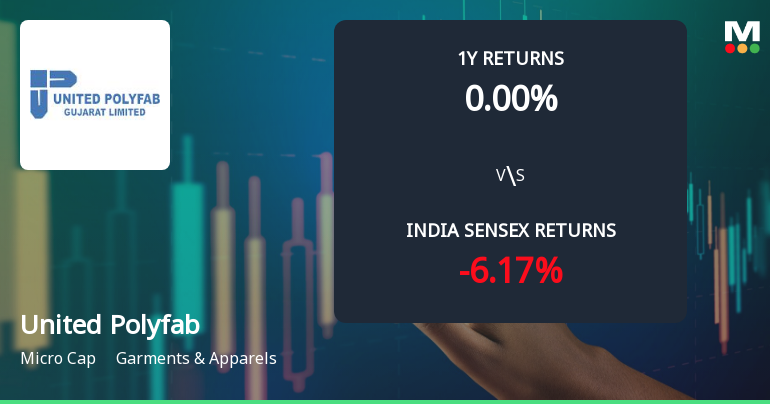
United Polyfab Gujarat Ltd Technical Momentum Shifts Amid Sideways Trend
United Polyfab Gujarat Ltd has experienced a notable shift in its technical momentum, moving from a mildly bearish stance to a sideways trend. Despite a modest intraday gain of 1.25%, the stock remains under pressure with a MarketsMOJO Mojo Grade downgraded to Strong Sell, reflecting ongoing challenges in the garments and apparels sector.
Read full news article
United Polyfab Gujarat Ltd is Rated Strong Sell
United Polyfab Gujarat Ltd is rated Strong Sell by MarketsMOJO, with this rating last updated on 26 May 2026. However, the analysis and financial metrics discussed here reflect the company’s current position as of 01 July 2026, providing investors with the latest insights into its performance and outlook.
Read full news article Announcements
United Polyfab Gujarat Limited - Outcome of Board Meeting
15-Nov-2019 | Source : NSEUnited Polyfab Gujarat Limited has informed the Exchange regarding Board meeting held on November 14, 2019.
Corporate Actions

No Upcoming Board Meetings

No Dividend history available

United Polyfab Gujarat Ltd has announced 1:10 stock split, ex-date: 02 May 25

United Polyfab Gujarat Ltd has announced 2:1 bonus issue, ex-date: 17 Feb 21

No Rights history available
Quality key factors
Valuation key factors
Technicals key factors
 Technical Indicator Scale: Bearish, Mildly Bearish, Sideways, Mildly Bullish, Bullish Turned
 Shareholding Snapshot : May 2016
Shareholding Compare (%holding)
Promoters
None
Held by 0 Schemes
Held by 0 FIIs
Nirmalkumar Mangalchand Mittal (19.43%)
Amaysha Textiles Private Limited (12.96%)
38.86%
Quarterly Results Snapshot (Consolidated) - Mar'26 - YoY

YoY Growth in quarter ended Mar 2026 is 12.12% vs -29.12% in Mar 2025

YoY Growth in quarter ended Mar 2026 is 81.03% vs 3,100.00% in Mar 2025
Half Yearly Results Snapshot (Standalone) - Sep'25
Growth in half year ended Sep 2025 is 11.80% vs -34.21% in Sep 2024
Growth in half year ended Sep 2025 is 54.81% vs 76.92% in Sep 2024
Nine Monthly Results Snapshot (Standalone) - Dec'25
YoY Growth in nine months ended Dec 2025 is 12.86% vs -35.18% in Dec 2024
YoY Growth in nine months ended Dec 2025 is 33.50% vs 104.60% in Dec 2024
Annual Results Snapshot (Consolidated) - Mar'26
YoY Growth in year ended Mar 2026 is 13.25% vs -33.71% in Mar 2025
YoY Growth in year ended Mar 2026 is 37.31% vs 167.62% in Mar 2025
About United Polyfab Gujarat Ltd

Company Coordinates


