
Compare Manomay Tex Indi with Similar Stocks
Dashboard
Low ability to service debt as the company has a high Debt to EBITDA ratio of 4.32 times
- Poor long term growth as Net Sales has grown by an annual rate of 0.56% over the last 5 years
- Low ability to service debt as the company has a high Debt to EBITDA ratio of 4.32 times
Poor long term growth as Net Sales has grown by an annual rate of 0.56% over the last 5 years
Flat results in Mar 26
Stock DNA
Garments & Apparels
INR 347 Cr (Micro Cap)
18.00
23
0.00%
2.33
12.44%
2.22
Total Returns (Price + Dividend) 
Manomay Tex Indi for the last several years.
Risk Adjusted Returns v/s
Returns Beta

News
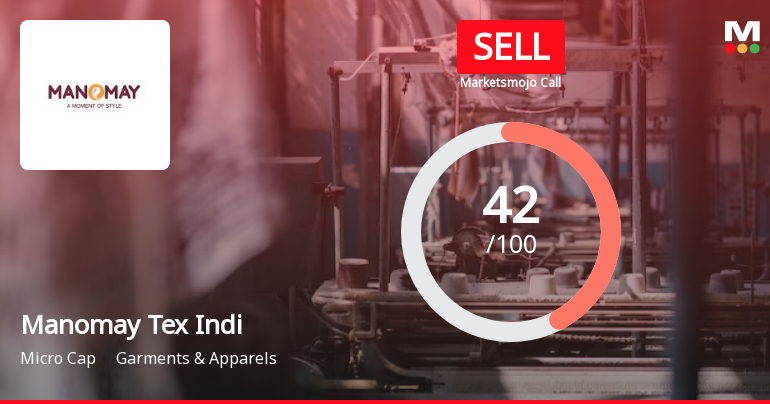
Manomay Tex India Ltd is Rated Sell by MarketsMOJO
Manomay Tex India Ltd is rated 'Sell' by MarketsMOJO, with this rating last updated on 01 June 2026. However, the analysis and financial metrics discussed here reflect the stock's current position as of 12 June 2026, providing investors with an up-to-date view of the company's fundamentals, returns, and market standing.
Read full news article
Manomay Tex India Ltd is Rated Hold
Manomay Tex India Ltd is rated 'Hold' by MarketsMOJO, with this rating last updated on 25 May 2026. However, the analysis and financial metrics discussed here reflect the company’s current position as of 01 June 2026, providing investors with the latest insights into its performance and outlook.
Read full news article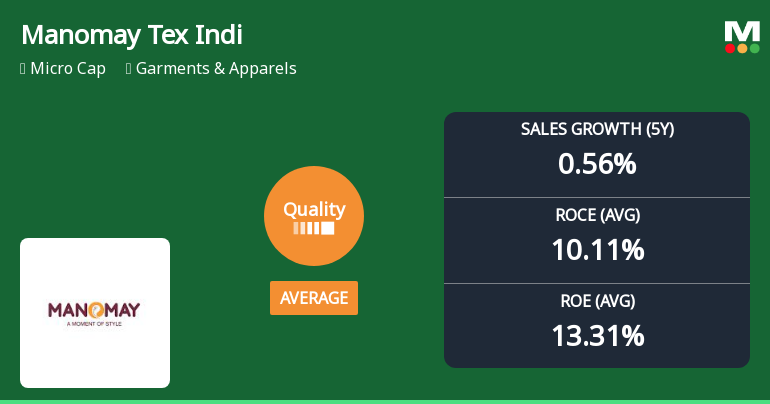
Manomay Tex India Ltd Upgrades Quality Grade Amid Improving Fundamentals
Manomay Tex India Ltd has seen a notable upgrade in its quality grading from below average to average, reflecting a positive shift in its business fundamentals. The garment and apparel company’s improved return ratios, manageable debt levels, and consistent earnings growth have contributed to this reassessment, signalling a more stable outlook for investors amid a challenging sector environment.
Read full news article Announcements
Corporate Actions

No Upcoming Board Meetings

No Dividend history available

No Splits history available

No Bonus history available

No Rights history available
Quality key factors
Valuation key factors
Technicals key factors
 Technical Indicator Scale: Bearish, Mildly Bearish, Sideways, Mildly Bullish, Bullish Turned
 Shareholding Snapshot : Mar 2026
Shareholding Compare (%holding)
Promoters
None
Held by 0 Schemes
Held by 1 FIIs (1.36%)
None
Seema Kamlesh Laddha (5.03%)
24.41%
Quarterly Results Snapshot (Standalone) - Mar'26 - YoY

YoY Growth in quarter ended Mar 2026 is 13.86% vs -2.99% in Mar 2025
YoY Growth in quarter ended Mar 2026 is 50.15% vs -17.78% in Mar 2025
Half Yearly Results Snapshot (Standalone) - Sep'25

Growth in half year ended Sep 2025 is -0.54% vs 21.21% in Sep 2024
Growth in half year ended Sep 2025 is 1.21% vs 94.12% in Sep 2024
Nine Monthly Results Snapshot (Standalone) - Dec'25
YoY Growth in nine months ended Dec 2025 is -2.13% vs 29.96% in Dec 2024
YoY Growth in nine months ended Dec 2025 is -8.04% vs 77.99% in Dec 2024
Annual Results Snapshot (Standalone) - Mar'26
YoY Growth in year ended Mar 2026 is 1.98% vs 19.52% in Mar 2025
YoY Growth in year ended Mar 2026 is 2.03% vs 48.08% in Mar 2025
About Manomay Tex India Ltd

Company Coordinates


