
Compare Sikko Industries with Similar Stocks
Dashboard
Poor Management Efficiency with a low ROCE of 9.79%
- The company has been able to generate a Return on Capital Employed (avg) of 9.79% signifying low profitability per unit of total capital (equity and debt)
Strong ability to service debt as the company has a low Debt to EBITDA ratio of 1.85 times
Poor long term growth as Net Sales has grown by an annual rate of 6.24% and Operating profit at 18.10% over the last 5 years
With ROCE of 5.9, it has a Expensive valuation with a 2.5 Enterprise value to Capital Employed
Majority shareholders : Promoters
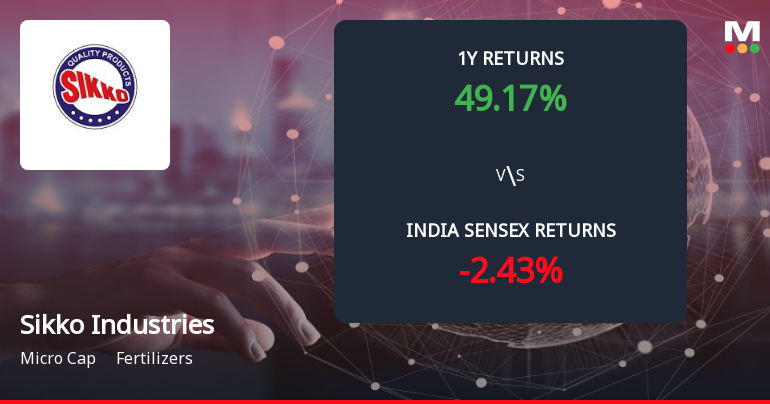
Below par performance in long term as well as near term
Total Returns (Price + Dividend) 
Latest dividend: 0.004944255937954435 per share ex-dividend date: Dec-28-2022
Risk Adjusted Returns v/s
Returns Beta

News
Sikko Industries Ltd Forms Death Cross, Signalling Potential Bearish Trend
Sikko Industries Ltd, a micro-cap player in the fertilisers sector, has recently formed a Death Cross, a technical pattern where the 50-day moving average crosses below the 200-day moving average. This development is widely regarded as a bearish signal, indicating a potential deterioration in the stock’s medium to long-term trend and raising concerns about sustained weakness ahead.
Read full news article
Sikko Industries Ltd is Rated Sell
Sikko Industries Ltd is rated Sell by MarketsMOJO, with this rating last updated on 13 July 2026. While the rating change occurred on that date, the analysis and financial metrics discussed here reflect the stock’s current position as of 28 July 2026, providing investors with the most up-to-date view of the company’s fundamentals and market performance.
Read full news article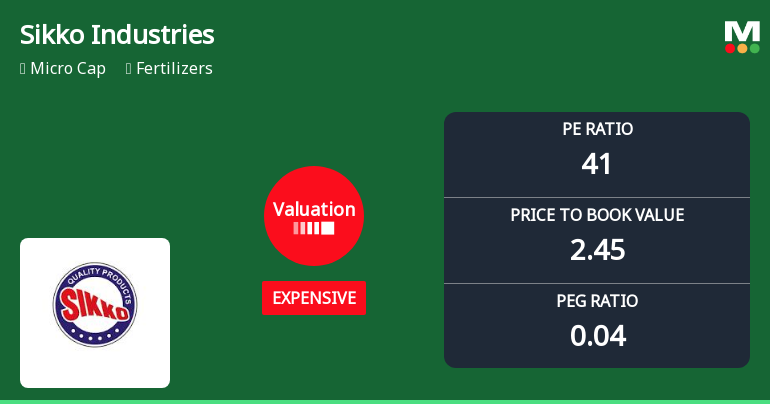
Sikko Industries Ltd Valuation Shifts Signal Elevated Price Risk Amid Sector Comparisons
Sikko Industries Ltd has witnessed a significant shift in its valuation parameters, moving from a fair to an expensive rating, driven primarily by a surge in its price-to-earnings (P/E) and price-to-book value (P/BV) ratios. This revaluation comes amid robust stock price gains and evolving sector dynamics, prompting a reassessment of its attractiveness relative to peers and historical benchmarks.
Read full news article Announcements
Sikko Industries Limited - Outcome of Board Meeting
15-Nov-2019 | Source : NSESikko Industries Limited has informed the Exchange regarding Board meeting held on November 14, 2019.
Sikko Industries Limited - Updates
18-Oct-2019 | Source : NSESikko Industries Limited has informed the Exchange regarding 'Intimation of Contact of personnel pursuant to Regulation 30(5) of the SEBI (Listing Obligations and Disclosure Requirements) Regulations, 2015.'.
Sikko Industries Limited - Updates
16-Oct-2019 | Source : NSESikko Industries Limited has informed the Exchange regarding 'Certificate under Regulation 74(5) of the SEBI (Depositories and Participants) Regulations, 2018 for the quarter ended September 30, 2019'.
Corporate Actions

No Upcoming Board Meetings

Sikko Industries Ltd has declared 1% dividend, ex-date: 28 Dec 22

Sikko Industries Ltd has announced 1:10 stock split, ex-date: 27 Nov 25

Sikko Industries Ltd has announced 1:1 bonus issue, ex-date: 08 Dec 25

Sikko Industries Ltd has announced 3:10 rights issue, ex-date: 06 Dec 24
Quality key factors
Valuation key factors
Technicals key factors
 Technical Indicator Scale: Bearish, Mildly Bearish, Sideways, Mildly Bullish, Bullish Turned
 Shareholding Snapshot : Jun 2026
Shareholding Compare (%holding)
Promoters
None
Held by 0 Schemes
Held by 6 FIIs (7.72%)
Jayantibhai Mohanbhai Kumbhani (25.52%)
Zeta Global Funds (oeic) Pcc Limited-zeta Series B Fund Pc (4.35%)
33.64%
Quarterly Results Snapshot (Standalone) - Mar'26 - YoY

YoY Growth in quarter ended Mar 2026 is -41.70% vs 32.10% in Mar 2025

YoY Growth in quarter ended Mar 2026 is -127.27% vs -235.38% in Mar 2025
Half Yearly Results Snapshot (Standalone) - Sep'25
Growth in half year ended Sep 2025 is 19.59% vs -6.73% in Sep 2024
Growth in half year ended Sep 2025 is 30.65% vs 83.33% in Sep 2024
Nine Monthly Results Snapshot (Standalone) - Dec'25
YoY Growth in nine months ended Dec 2025 is 25.95% vs -8.78% in Dec 2024
YoY Growth in nine months ended Dec 2025 is 37.86% vs 51.03% in Dec 2024
Annual Results Snapshot (Standalone) - Mar'26
YoY Growth in year ended Mar 2026 is 5.28% vs 0.75% in Mar 2025
YoY Growth in year ended Mar 2026 is 19.67% vs 5.17% in Mar 2025
About Sikko Industries Ltd

Company Coordinates


