
Compare Univastu India with Similar Stocks
Dashboard
High Management Efficiency with a high ROCE of 23.23%
Strong ability to service debt as the company has a low Debt to EBITDA ratio of 0.85 times
With a growth in Net Sales of 174.22%, the company declared Outstanding results in Mar 26
With ROCE of 32.6, it has a Attractive valuation with a 2.9 Enterprise value to Capital Employed
Majority shareholders : Promoters
Total Returns (Price + Dividend) 
Univastu India for the last several years.
Risk Adjusted Returns v/s
Returns Beta

News

Univastu India Ltd is Rated Strong Buy
Univastu India Ltd is rated Strong Buy by MarketsMOJO, with this rating last updated on 15 June 2026. However, the analysis and financial metrics discussed here reflect the stock’s current position as of 22 June 2026, providing investors with the most up-to-date view of the company’s fundamentals, returns, and market standing.
Read full news article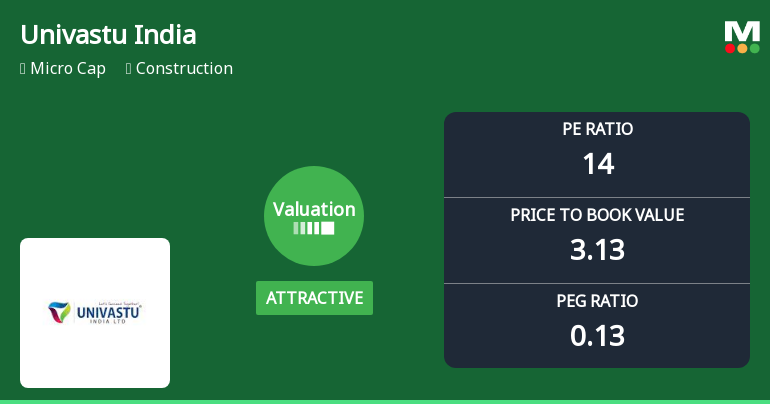
Univastu India Ltd’s Valuation Shift Signals Growing Price Attractiveness Amid Strong Market Performance
Univastu India Ltd has witnessed a notable shift in its valuation parameters, moving from a very attractive to an attractive grade, reflecting a recalibration of price-to-earnings and price-to-book value metrics. This change, coupled with robust financial performance and strong market returns, positions the micro-cap construction firm as a compelling prospect for investors seeking value within the sector.
Read full news article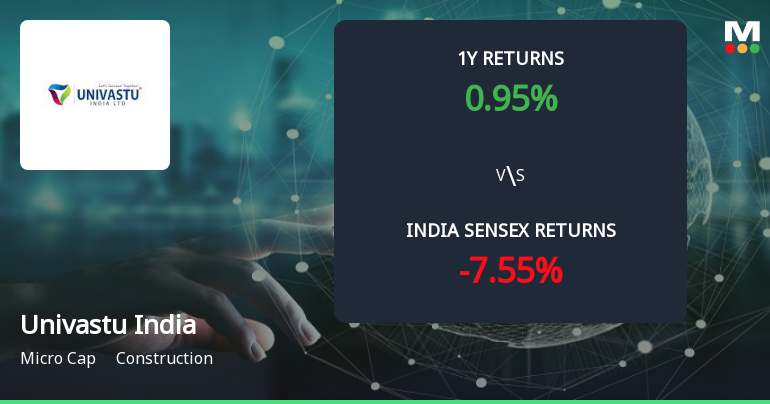
Golden Cross Forms in Univastu India Ltd — Mixed Technical Signals and Micro-Cap Context
The 50-day moving average has crossed above the 200-day moving average for Univastu India Ltd, signalling a golden cross on 12 Jun 2026. Yet, the broader technical picture is conflicted, with monthly momentum indicators mildly bearish and the stock’s micro-cap status adding a layer of caution to interpreting this signal.
Read full news article Announcements
Univastu India Limited - Trading Window
18-Nov-2019 | Source : NSEUnivastu India Limited has informed the Exchange regarding the Trading Window closure pursuant to SEBI (Prohibition of Insider Trading) Regulations, 2015
Univastu India Limited - Appointment
15-Nov-2019 | Source : NSEUnivastu India Limited has informed the Exchange regarding Appointment of Ms MV AND ASSOCIATES COMPANY SECRETARIES as Secretarial Auditor of the company w.e.f. November 14, 2019.
Univastu India Limited - Updates
22-Oct-2019 | Source : NSEUnivastu India Limited has informed the Exchange regarding 'Certificate under Reg 74(5) of SEBI (Depositories and Participants), Regulations, 2018'.
Corporate Actions

No Upcoming Board Meetings

No Dividend history available

No Splits history available

Univastu India Ltd has announced 2:1 bonus issue, ex-date: 13 Oct 25

No Rights history available
Quality key factors
Valuation key factors
Technicals key factors
 Technical Indicator Scale: Bearish, Mildly Bearish, Sideways, Mildly Bullish, Bullish Turned
 Shareholding Snapshot : Mar 2026
Shareholding Compare (%holding)
Promoters
None
Held by 0 Schemes
Held by 0 FIIs
Pradeep Kisan Khandagale (63.48%)
Sujata C Joshi (1.05%)
26.94%
Quarterly Results Snapshot (Consolidated) - Mar'26 - YoY

YoY Growth in quarter ended Mar 2026 is 174.22% vs 1.68% in Mar 2025
YoY Growth in quarter ended Mar 2026 is 264.41% vs -14.07% in Mar 2025
Half Yearly Results Snapshot (Consolidated) - Sep'25

Growth in half year ended Sep 2025 is 10.32% vs 37.34% in Sep 2024
Growth in half year ended Sep 2025 is 59.56% vs 55.82% in Sep 2024
Nine Monthly Results Snapshot (Consolidated) - Dec'25
YoY Growth in nine months ended Dec 2025 is 19.06% vs 38.43% in Dec 2024
YoY Growth in nine months ended Dec 2025 is 68.47% vs 69.20% in Dec 2024
Annual Results Snapshot (Consolidated) - Mar'26
YoY Growth in year ended Mar 2026 is 42.16% vs 42.07% in Mar 2025
YoY Growth in year ended Mar 2026 is 122.64% vs 47.67% in Mar 2025
About Univastu India Ltd

Company Coordinates


