
Compare Geekay Wires with Similar Stocks
Stock DNA
Iron & Steel Products
INR 269 Cr (Micro Cap)
9.00
26
1.26%
0.83
17.54%
1.55
Total Returns (Price + Dividend) 
Latest dividend: 0.32 per share ex-dividend date: Sep-19-2025
Risk Adjusted Returns v/s
Returns Beta

News
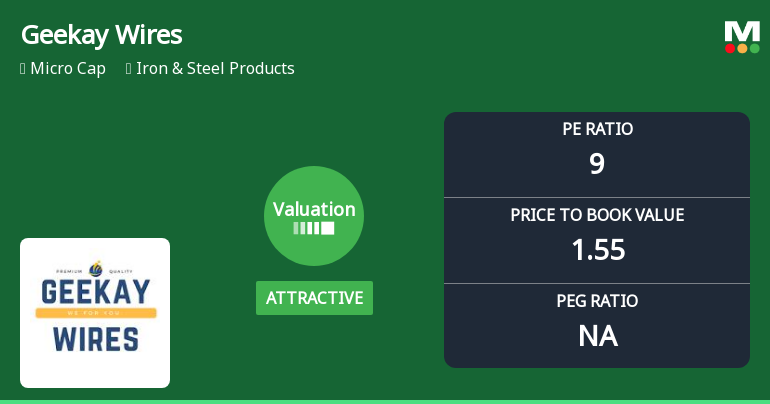
Geekay Wires Ltd Valuation Improves Amidst Challenging Market Returns
Geekay Wires Ltd, a micro-cap player in the Iron & Steel Products sector, has seen its valuation parameters improve from very attractive to attractive, signalling a potential shift in price attractiveness despite a challenging return profile relative to the broader market. This article analyses the recent changes in key valuation metrics, compares them with peer averages, and assesses the implications for investors.
Read full news article
Geekay Wires Ltd is Rated Sell
Geekay Wires Ltd is rated 'Sell' by MarketsMOJO, with this rating last updated on 02 February 2026. However, the analysis and financial metrics discussed here reflect the stock's current position as of 11 June 2026, providing investors with an up-to-date view of the company’s fundamentals, returns, and market standing.
Read full news article
Geekay Wires Ltd is Rated Sell
Geekay Wires Ltd is rated 'Sell' by MarketsMOJO, a rating that was last updated on 02 Feb 2026. However, the analysis and financial metrics discussed here reflect the company’s current position as of 29 May 2026, providing investors with the latest insights into the stock’s performance and outlook.
Read full news article Announcements
Geekay Wires Limited - Clarification - Financial Results
27-Nov-2019 | Source : NSEGeekay Wires Limitedes Limited for the quarter ended 30-Sep-2019 with respect to Regulation 33 of the SEBI (Listing Obligations and Disclosure Requirements) Regulations, 2015.
Geekay Wires Limited - Outcome of Board Meeting
14-Nov-2019 | Source : NSEGeekay Wires Limited has informed the Exchange regarding Board meeting held on November 14, 2019.
Geekay Wires Limited - Shareholders meeting
01-Nov-2019 | Source : NSEGeekay Wires Limited has submitted the Exchange a copy Srutinizers report of Postal Ballot. Further, the company has informed the Exchange regarding voting results.
Corporate Actions

No Upcoming Board Meetings

Geekay Wires Ltd has declared 32% dividend, ex-date: 19 Sep 25

Geekay Wires Ltd has announced 1:2 stock split, ex-date: 30 Oct 25

No Bonus history available

No Rights history available
Quality key factors
Valuation key factors
Technicals key factors
 Technical Indicator Scale: Bearish, Mildly Bearish, Sideways, Mildly Bullish, Bullish Turned
 Shareholding Snapshot : Mar 2026
Shareholding Compare (%holding)
Promoters
None
Held by 0 Schemes
Held by 3 FIIs (0.14%)
Kandoi Industries India Private Limited (19.98%)
Surendra Kumar Mittal Huf (1.59%)
31.78%
Quarterly Results Snapshot (Standalone) - Mar'26 - YoY

YoY Growth in quarter ended Mar 2026 is -11.79% vs 25.65% in Mar 2025

YoY Growth in quarter ended Mar 2026 is -8.41% vs -25.25% in Mar 2025
Half Yearly Results Snapshot (Standalone) - Sep'25
Growth in half year ended Sep 2025 is -2.29% vs 6.82% in Sep 2024
Growth in half year ended Sep 2025 is -19.24% vs 5.72% in Sep 2024
Nine Monthly Results Snapshot (Standalone) - Dec'25
YoY Growth in nine months ended Dec 2025 is -0.86% vs 6.86% in Dec 2024
YoY Growth in nine months ended Dec 2025 is -19.06% vs 0.66% in Dec 2024
Annual Results Snapshot (Standalone) - Mar'26
YoY Growth in year ended Mar 2026 is -3.82% vs 11.36% in Mar 2025
YoY Growth in year ended Mar 2026 is -16.89% vs -8.00% in Mar 2025
About Geekay Wires Ltd

Company Coordinates


