
Compare Total Transport with Similar Stocks
Dashboard
Weak Long Term Fundamental Strength with a 14.57% CAGR growth in Net Sales over the last 5 years
- The company has been able to generate a Return on Equity (avg) of 8.98% signifying low profitability per unit of shareholders funds
With a fall in Net Sales of -1%, the company declared Very Negative results in Mar 26
Below par performance in long term as well as near term
Stock DNA
Transport Services
INR 84 Cr (Micro Cap)
11.00
36
0.00%
0.09
8.61%
0.91
Total Returns (Price + Dividend) 
Latest dividend: 0.7 per share ex-dividend date: Feb-22-2023
Risk Adjusted Returns v/s
Returns Beta

News

Total Transport Systems Ltd is Rated Strong Sell
Total Transport Systems Ltd is rated Strong Sell by MarketsMOJO. This rating was last updated on 21 May 2026. However, the analysis and financial metrics discussed here reflect the company’s current position as of 17 June 2026, providing investors with the most up-to-date view of the stock’s fundamentals, returns, and technical outlook.
Read full news article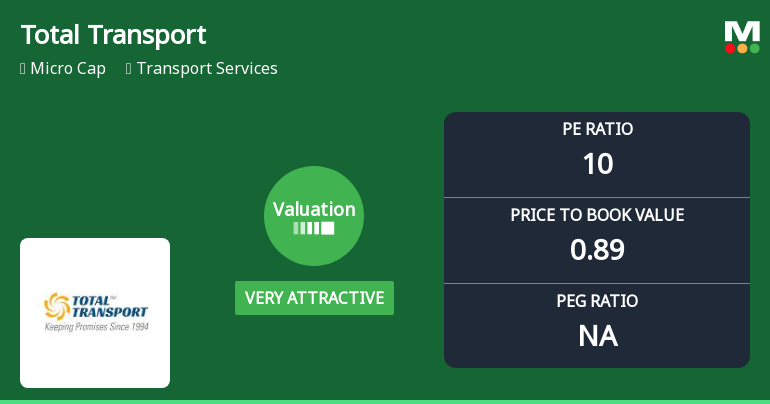
Total Transport Systems Ltd Valuation Shifts Signal Renewed Price Attractiveness
Total Transport Systems Ltd has seen a marked shift in its valuation parameters, moving from an attractive to a very attractive rating despite ongoing market headwinds and a deteriorating share price. This article analyses the recent changes in key valuation metrics such as price-to-earnings (P/E) and price-to-book value (P/BV) ratios, compares them with peer averages and historical benchmarks, and assesses what this means for investors navigating the transport services sector.
Read full news article
Total Transport Systems Ltd is Rated Strong Sell
Total Transport Systems Ltd is rated Strong Sell by MarketsMOJO. This rating was last updated on 21 May 2026, reflecting a significant reassessment of the stock’s outlook. However, the analysis and financial metrics presented here are based on the company’s current position as of 04 June 2026, providing investors with the most up-to-date view of its fundamentals, valuation, financial trend, and technical standing.
Read full news article Announcements
Total Transport Systems Limited - Outcome of Board Meeting
15-Nov-2019 | Source : NSETotal Transport Systems Limited has informed the Exchange regarding Board meeting held on November 14, 2019.
Corporate Actions

No Upcoming Board Meetings

Total Transport Systems Ltd has declared 7% dividend, ex-date: 22 Feb 23

No Splits history available

No Bonus history available

No Rights history available
Quality key factors
Valuation key factors
Technicals key factors
 Technical Indicator Scale: Bearish, Mildly Bearish, Sideways, Mildly Bullish, Bullish Turned
 Shareholding Snapshot : Mar 2026
Shareholding Compare (%holding)
Non Institution
None
Held by 0 Schemes
Held by 0 FIIs
Pradhan Makarand Prabhakar (16.94%)
Leena Prashant Salvi (15.83%)
26.78%
Quarterly Results Snapshot (Consolidated) - Mar'26 - YoY

YoY Growth in quarter ended Mar 2026 is -1.00% vs 5.37% in Mar 2025
YoY Growth in quarter ended Mar 2026 is -93.97% vs 1,020.63% in Mar 2025
Half Yearly Results Snapshot (Consolidated) - Sep'25
Growth in half year ended Sep 2025 is -6.91% vs 48.27% in Sep 2024

Growth in half year ended Sep 2025 is 2,952.94% vs -84.55% in Sep 2024
Nine Monthly Results Snapshot (Consolidated) - Dec'25
YoY Growth in nine months ended Dec 2025 is -8.27% vs 49.79% in Dec 2024
YoY Growth in nine months ended Dec 2025 is 137.70% vs 66.49% in Dec 2024
Annual Results Snapshot (Consolidated) - Mar'26
YoY Growth in year ended Mar 2026 is -6.56% vs 36.29% in Mar 2025
YoY Growth in year ended Mar 2026 is -12.65% vs 614.40% in Mar 2025
About Total Transport Systems Ltd

Company Coordinates


