
Compare Airo Lam with Similar Stocks
Dashboard
Weak Long Term Fundamental Strength with an average Return on Capital Employed (ROCE) of 8.65%
- Poor long term growth as Net Sales has grown by an annual rate of 6.81% and Operating profit at 2.38% over the last 5 years
- Low ability to service debt as the company has a high Debt to EBITDA ratio of 4.25 times
- PAT(Q) At Rs 0.32 cr has Fallen at -88.6%
- OPERATING PROFIT TO INTEREST (Q) Lowest at 1.45 times
- PBDIT(Q) Lowest at Rs 3.27 cr.
Below par performance in long term as well as near term
Stock DNA
Plywood Boards/ Laminates
INR 126 Cr (Micro Cap)
23.00
46
0.00%
1.02
7.03%
1.64
Total Returns (Price + Dividend) 
Airo Lam for the last several years.
Risk Adjusted Returns v/s
Returns Beta

News

Airo Lam Ltd is Rated Strong Sell
Airo Lam Ltd is rated Strong Sell by MarketsMOJO, with this rating last updated on 29 May 2026. However, the analysis and financial metrics discussed here reflect the stock’s current position as of 15 June 2026, providing investors with the most recent and relevant data to assess the company’s outlook.
Read full news article
Airo Lam Ltd is Rated Strong Sell
Airo Lam Ltd is rated Strong Sell by MarketsMOJO, with this rating last updated on 29 May 2026. However, the analysis and financial metrics discussed here reflect the stock’s current position as of 01 June 2026, providing investors with the most up-to-date view of the company’s fundamentals, returns, and technical outlook.
Read full news article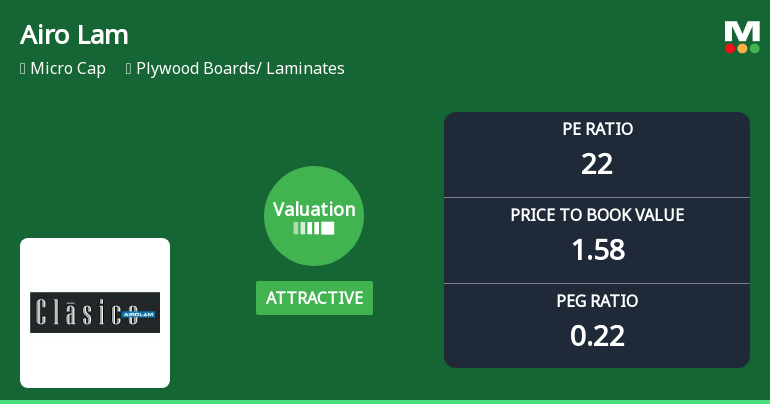
Airo Lam Ltd Valuation Shifts Signal Changing Price Attractiveness Amid Market Challenges
Airo Lam Ltd, a micro-cap player in the plywood boards and laminates sector, has witnessed a notable shift in its valuation parameters, moving from a very attractive to an attractive rating. Despite this improvement in price metrics, the company’s recent stock performance has lagged behind the broader market, reflecting a complex investment landscape for shareholders and potential investors alike.
Read full news article Announcements
Airo Lam limited - Other General Purpose
09-Dec-2019 | Source : NSEAiro Lam limited has informed the Exchange regarding Disclosure of Related Party Transactions under Regulation 23(9) of the SEBI (Listing Obligations and Disclosure Requirements) Regulations, 2015.
Airo Lam limited - Outcome of Board Meeting
15-Nov-2019 | Source : NSEAiro Lam limited has informed the Exchange regarding Board meeting held on November 14, 2019.
Corporate Actions

No Upcoming Board Meetings

No Dividend history available

No Splits history available

No Bonus history available

No Rights history available
Quality key factors
Valuation key factors
Technicals key factors
 Technical Indicator Scale: Bearish, Mildly Bearish, Sideways, Mildly Bullish, Bullish Turned
 Shareholding Snapshot : Mar 2026
Shareholding Compare (%holding)
Promoters
18.7216
Held by 0 Schemes
Held by 0 FIIs
Pravinbhai Nathabhai Patel (8.55%)
Patel Anjanaben M (2.31%)
34.12%
Quarterly Results Snapshot (Consolidated) - Mar'26 - YoY

YoY Growth in quarter ended Mar 2026 is 3.12% vs 10.31% in Mar 2025
YoY Growth in quarter ended Mar 2026 is -88.57% vs 67.66% in Mar 2025
Half Yearly Results Snapshot (Consolidated) - Sep'25

Growth in half year ended Sep 2025 is 11.02% vs 5.56% in Sep 2024
Growth in half year ended Sep 2025 is 420.51% vs -127.34% in Sep 2024
Nine Monthly Results Snapshot (Consolidated) - Dec'25
YoY Growth in nine months ended Dec 2025 is 17.23% vs 1.68% in Dec 2024
YoY Growth in nine months ended Dec 2025 is 4,433.33% vs -101.95% in Dec 2024
Annual Results Snapshot (Consolidated) - Mar'26
YoY Growth in year ended Mar 2026 is 13.53% vs 3.81% in Mar 2025
YoY Growth in year ended Mar 2026 is 88.05% vs -62.63% in Mar 2025
About Airo Lam Ltd

Company Coordinates


