
Compare Sheetal Cool with Similar Stocks
Dashboard
High Management Efficiency with a high ROCE of 17.78%
Poor long term growth as Net Sales has grown by an annual rate of -5.55% and Operating profit at -1.50% over the last 5 years
The company has declared positive results in Dec'2025 after 2 consecutive negative quarters
With ROCE of 16, it has a Fair valuation with a 2 Enterprise value to Capital Employed
Falling Participation by Institutional Investors
Total Returns (Price + Dividend) 
Sheetal Cool for the last several years.
Risk Adjusted Returns v/s
Returns Beta

News

Sheetal Cool Products Ltd Hits Lower Circuit Amid Heavy Selling Pressure
Sheetal Cool Products Ltd, a micro-cap player in the FMCG sector, witnessed a sharp decline on 20 Feb 2026, hitting its lower circuit limit as panic selling gripped investors. The stock closed at ₹323.05, down 5.0% on the day, underperforming both its sector and the broader market amid unrelenting selling pressure and a significant drop in trading volumes.
Read full news article
Sheetal Cool Products Ltd Downgraded to Hold Amid Mixed Financial and Valuation Signals
Sheetal Cool Products Ltd has seen its investment rating downgraded from Buy to Hold as of 19 February 2026, reflecting a nuanced shift in its financial performance, valuation metrics, and technical indicators. While recent quarterly results show encouraging growth, concerns over valuation and long-term trends have tempered investor enthusiasm.
Read full news article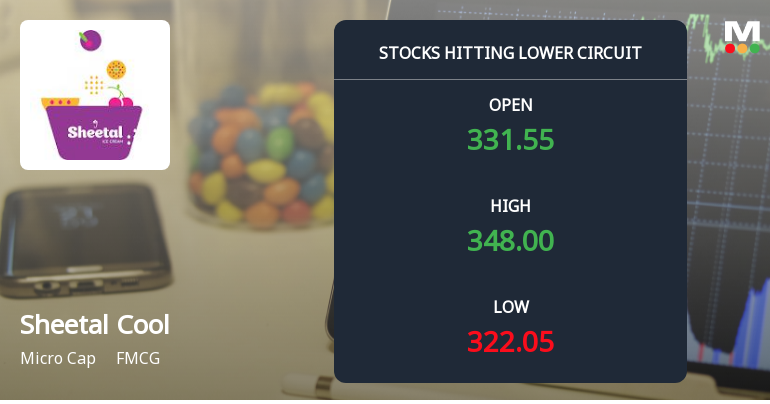
Sheetal Cool Products Ltd Hits Lower Circuit Amid Heavy Selling Pressure
Sheetal Cool Products Ltd, a micro-cap player in the FMCG sector, witnessed intense selling pressure on 19 Feb 2026, culminating in the stock hitting its lower circuit limit. The share price plunged by 4.99% to close at ₹320.65, marking the maximum permissible daily loss and signalling panic selling among investors amid volatile market conditions.
Read full news article Announcements
Corporate Actions

No Upcoming Board Meetings

No Dividend history available

No Splits history available

No Bonus history available

No Rights history available
Quality key factors
Valuation key factors
Technicals key factors
 Technical Indicator Scale: Bearish, Mildly Bearish, Sideways, Mildly Bullish, Bullish Turned
 Shareholding Snapshot : Dec 2025
Shareholding Compare (%holding)
Promoters
None
Held by 0 Schemes
Held by 1 FIIs (0.0%)
Sanjay Dakubhai Bhuva (17.29%)
Zaki Abbas Nasser (3.29%)
31.48%
Quarterly Results Snapshot (Standalone) - Dec'25 - YoY

YoY Growth in quarter ended Dec 2025 is 25.23% vs -18.58% in Dec 2024
YoY Growth in quarter ended Dec 2025 is 87.38% vs -19.85% in Dec 2024
Half Yearly Results Snapshot (Standalone) - Sep'25
Growth in half year ended Sep 2025 is -4.49% vs -13.92% in Sep 2024

Growth in half year ended Sep 2025 is -28.38% vs -12.31% in Sep 2024
Nine Monthly Results Snapshot (Standalone) - Dec'25
YoY Growth in nine months ended Dec 2025 is 2.17% vs -15.01% in Dec 2024
YoY Growth in nine months ended Dec 2025 is -7.44% vs -13.78% in Dec 2024
Annual Results Snapshot (Standalone) - Mar'25
YoY Growth in year ended Mar 2025 is -8.90% vs 3.66% in Mar 2024
YoY Growth in year ended Mar 2025 is -20.49% vs 1.91% in Mar 2024
About Sheetal Cool Products Ltd

Company Coordinates


