
Compare Silly Monks with Similar Stocks
Dashboard
With a Operating Losses, the company has a Weak Long Term Fundamental Strength
- Company's ability to service its debt is weak with a poor EBIT to Interest (avg) ratio of -2.11
- The company has been able to generate a Return on Equity (avg) of 0.85% signifying low profitability per unit of shareholders funds
Negative results in Mar 26
Risky - Negative EBITDA
Below par performance in long term as well as near term
Stock DNA
Media & Entertainment
INR 23 Cr (Micro Cap)
NA (Loss Making)
68
0.00%
-0.39
-16.58%
1.68
Total Returns (Price + Dividend) 
Latest dividend: 0.5 per share ex-dividend date: Feb-15-2021
Risk Adjusted Returns v/s
Returns Beta

News
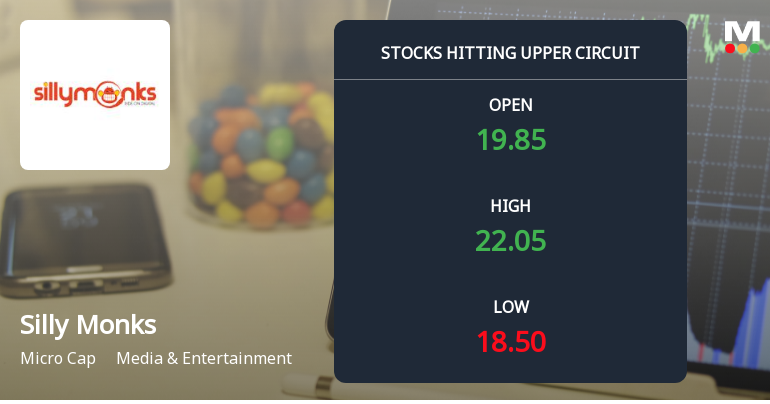
Silly Monks Entertainment Ltd Locks at Upper Circuit With 1.69% Gain — Buyers Queue, Sellers Absent
At Rs 22.05, the buying was done — not because demand dried up, but because the exchange wouldn't let the stock go any higher. Silly Monks Entertainment Ltd locked at its upper circuit of 1.69% on 11 Jun 2026, with buyers queuing and no sellers willing to part with shares.
Read full news articleAre Silly Monks Entertainment Ltd latest results good or bad?
The latest financial results for Silly Monks Entertainment Ltd for Q4 FY26 reveal significant operational challenges and a concerning trend in financial performance. The company reported a net profit of -₹1.12 crores, reflecting a drastic year-on-year decline of 11,100%. Revenue for the quarter was ₹5.07 crores, which represents a 21.64% decrease compared to the same period last year, marking the lowest quarterly revenue recorded in recent history. Operating margins have also deteriorated sharply, with an operating margin of -19.92%, the lowest ever for the company. This is a stark contrast to the previous year when the company had a positive operating profit margin of 1.24%. The profit after tax margin fell to -22.09%, indicating that the company is struggling to cover its basic operating costs with current revenue levels. The trend analysis indicates that revenue has contracted for three consecutive qu...
Read full news article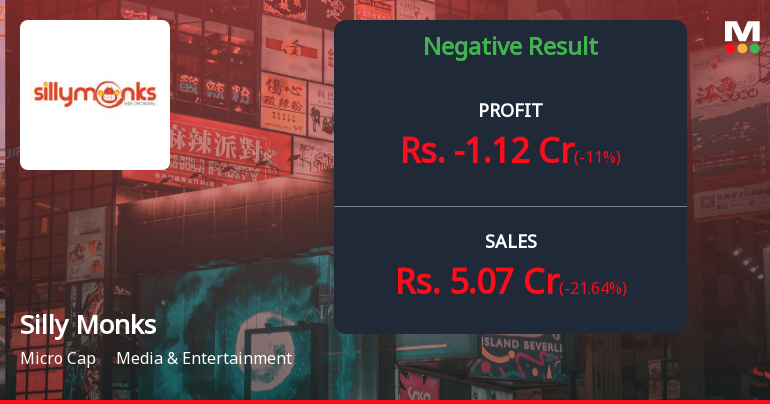
Silly Monks Entertainment Q4 FY26: Mounting Losses and Deteriorating Operations Signal Deep Distress
Silly Monks Entertainment Ltd., a micro-cap media and entertainment company with a market capitalisation of ₹21.00 crores, reported deeply concerning fourth-quarter results for FY26, with consolidated net losses widening dramatically to ₹1.12 crores from ₹0.01 crores in the corresponding quarter last year—representing an alarming 11,100% deterioration year-on-year. The stock, currently trading at ₹16.71, has declined 2.17% following the results announcement, reflecting investor anxiety over the company's worsening financial trajectory and operational challenges.
Read full news article Announcements
Silly Monks Entertainment Limited - Diversification/Disinvestment
30-Oct-2019 | Source : NSESilly Monks Entertainment Limited has informed the Exchange about Diversification/Disinvestment
Corporate Actions

No Upcoming Board Meetings

Silly Monks Entertainment Ltd has declared 5% dividend, ex-date: 15 Feb 21

No Splits history available

Silly Monks Entertainment Ltd has announced 6:5 bonus issue, ex-date: 11 Feb 20

No Rights history available
Quality key factors
Valuation key factors
Technicals key factors
 Technical Indicator Scale: Bearish, Mildly Bearish, Sideways, Mildly Bullish, Bullish Turned
 Shareholding Snapshot : Mar 2026
Shareholding Compare (%holding)
Promoters
None
Held by 0 Schemes
Held by 0 FIIs
Satyapoorna Chander Yalamanchili (50.04%)
Satish Kumar Tondapu (5.42%)
44.45%
Quarterly Results Snapshot (Consolidated) - Mar'26 - YoY

YoY Growth in quarter ended Mar 2026 is -21.64% vs 20.48% in Mar 2025
YoY Growth in quarter ended Mar 2026 is -11,100.00% vs -104.17% in Mar 2025
Half Yearly Results Snapshot (Consolidated) - Sep'25
Growth in half year ended Sep 2025 is -3.06% vs 17.62% in Sep 2024
Growth in half year ended Sep 2025 is -350.00% vs 172.73% in Sep 2024
Nine Monthly Results Snapshot (Consolidated) - Dec'25
YoY Growth in nine months ended Dec 2025 is -9.00% vs 17.53% in Dec 2024
YoY Growth in nine months ended Dec 2025 is -514.29% vs 290.91% in Dec 2024
Annual Results Snapshot (Consolidated) - Mar'26
YoY Growth in year ended Mar 2026 is -12.04% vs 18.25% in Mar 2025
YoY Growth in year ended Mar 2026 is -1,095.00% vs 0.00% in Mar 2025
About Silly Monks Entertainment Ltd

Company Coordinates


