
Compare Ashoka Metcast with Similar Stocks
Dashboard
Weak Long Term Fundamental Strength with a -2.15% CAGR growth in Operating Profits over the last 5 years
- The company has been able to generate a Return on Equity (avg) of 6.28% signifying low profitability per unit of shareholders funds
Consistent Underperformance against the benchmark over the last 3 years
Stock DNA
Non - Ferrous Metals
INR 39 Cr (Micro Cap)
3.00
23
0.00%
0.46
8.85%
0.31
Total Returns (Price + Dividend) 
Ashoka Metcast for the last several years.
Risk Adjusted Returns v/s
Returns Beta

News
Ashoka Metcast Ltd Downgraded to Sell Amid Technical and Fundamental Concerns
Ashoka Metcast Ltd, a micro-cap player in the Non-Ferrous Metals sector, has seen its investment rating downgraded from Hold to Sell as of 22 June 2026. This shift reflects a combination of deteriorating technical indicators, subdued long-term financial trends, and valuation concerns despite some recent positive quarterly results. The company’s Mojo Score now stands at 43.0, signalling caution for investors amid ongoing challenges.
Read full news article
Ashoka Metcast Ltd is Rated Hold
Ashoka Metcast Ltd is rated 'Hold' by MarketsMOJO, with this rating last updated on 15 June 2026. However, the analysis and financial metrics discussed here reflect the stock's current position as of 18 June 2026, providing investors with the most recent insights into the company’s performance and outlook.
Read full news article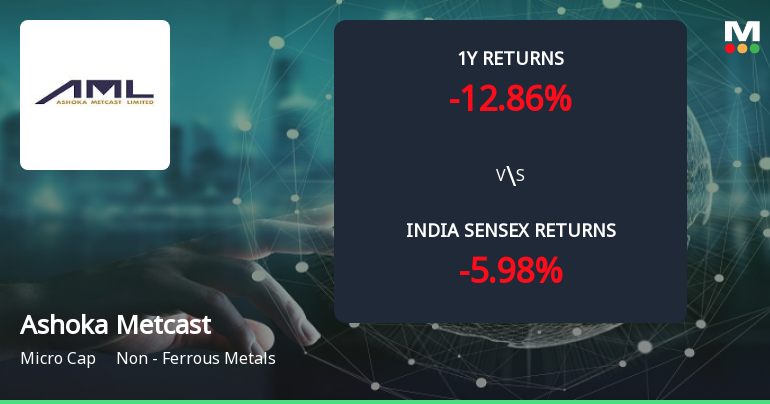
Ashoka Metcast Ltd Forms Golden Cross Amid Mixed Technical Signals and Micro-Cap Constraints
The 50-day moving average has crossed above the 200-day moving average for Ashoka Metcast Ltd, signalling a golden cross on 15 Jun 2026. Yet, the daily price action and monthly technical indicators paint a more nuanced picture, raising questions about the strength of this signal in the context of a micro-cap stock with mixed momentum.
Read full news article Announcements
Corporate Actions

No Upcoming Board Meetings

No Dividend history available

No Splits history available

No Bonus history available

No Rights history available
Quality key factors
Valuation key factors
Technicals key factors
 Technical Indicator Scale: Bearish, Mildly Bearish, Sideways, Mildly Bullish, Bullish Turned
 Shareholding Snapshot : Mar 2026
Shareholding Compare (%holding)
Promoters
None
Held by 0 Schemes
Held by 0 FIIs
Shalin Ashok Shah (22.18%)
None
43.51%
Quarterly Results Snapshot (Consolidated) - Mar'26 - YoY

YoY Growth in quarter ended Mar 2026 is 59.48% vs -83.52% in Mar 2025
YoY Growth in quarter ended Mar 2026 is 311.11% vs -84.87% in Mar 2025
Half Yearly Results Snapshot (Consolidated) - Sep'25

Growth in half year ended Sep 2025 is -58.30% vs 27.12% in Sep 2024
Growth in half year ended Sep 2025 is -18.36% vs 372.64% in Sep 2024
Nine Monthly Results Snapshot (Consolidated) - Dec'25
YoY Growth in nine months ended Dec 2025 is -46.54% vs 20.89% in Dec 2024
YoY Growth in nine months ended Dec 2025 is 26.18% vs 372.22% in Dec 2024
Annual Results Snapshot (Consolidated) - Mar'26
YoY Growth in year ended Mar 2026 is -28.90% vs -41.19% in Mar 2025
YoY Growth in year ended Mar 2026 is 47.14% vs 53.24% in Mar 2025
About Ashoka Metcast Ltd

Company Coordinates


