
Compare Hindcon Chemical with Similar Stocks
Stock DNA
Chemicals & Petrochemicals
INR 105 Cr (Micro Cap)
33.00
45
0.00%
-0.14
5.66%
1.88
Total Returns (Price + Dividend) 
Latest dividend: 0.1 per share ex-dividend date: Aug-13-2024
Risk Adjusted Returns v/s
Returns Beta

News
Hindcon Chemicals Ltd is Rated Sell
Hindcon Chemicals Ltd is rated 'Sell' by MarketsMOJO, with this rating last updated on 15 May 2026. However, the analysis and financial metrics discussed here reflect the stock's current position as of 27 June 2026, providing investors with an up-to-date view of the company’s performance and outlook.
Read full news article
Hindcon Chemicals Ltd is Rated Sell
Hindcon Chemicals Ltd is rated 'Sell' by MarketsMOJO, with this rating last updated on 15 May 2026. However, the analysis and financial metrics discussed here reflect the stock's current position as of 16 June 2026, providing investors with the most up-to-date view of the company’s fundamentals, valuation, financial trends, and technical outlook.
Read full news article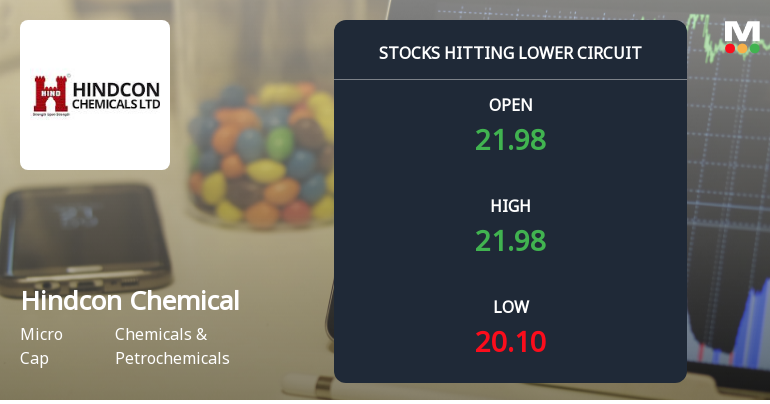
Hindcon Chemicals Ltd Locks at Lower Circuit With 4.96% Loss — Sellers Queue, No Buyers in Sight
At Rs 20.10, sellers were still queuing — but there were no buyers willing to take the other side. Hindcon Chemicals Ltd locked at its lower circuit of 4.96% on 11 Jun 2026, with unfilled sell orders and a frozen price.
Read full news article Announcements
Hindcon Chemicals Limited - Reply to Clarification- Financial results
05-Dec-2019 | Source : NSEHindcon Chemicals Limitedon Chemicals Limited for the quarter ended 30-Sep-2019 with respect to Regulation 33 of the SEBI (Listing Obligations and Disclosure Requirements) Regulations, 2015.
Hindcon Chemicals Limited - Other General Purpose
18-Nov-2019 | Source : NSEHindcon Chemicals Limited has informed the Exchange regarding Disclosure of Related Party Transactions pursuant to Regulation 23(9) of SEBI ( LODR) Regulations, 2015.
Hindcon Chemicals Limited - Updates
08-Nov-2019 | Source : NSEHindcon Chemicals Limited has informed the Exchange regarding 'Newspaper Publication of Un-audited Standalone and Consolidated Financial Results for half year ended 30.09.2019'.
Corporate Actions

No Upcoming Board Meetings

Hindcon Chemicals Ltd has declared 5% dividend, ex-date: 13 Aug 24

Hindcon Chemicals Ltd has announced 2:10 stock split, ex-date: 10 Nov 23

No Bonus history available

No Rights history available
Quality key factors
Valuation key factors
Technicals key factors
 Technical Indicator Scale: Bearish, Mildly Bearish, Sideways, Mildly Bullish, Bullish Turned
 Shareholding Snapshot : Mar 2026
Shareholding Compare (%holding)
Promoters
None
Held by 0 Schemes
Held by 0 FIIs
Hindcon Solutions Private Limited (24.69%)
J N B Sidhu Finance Private Limited (2.58%)
24.51%
Quarterly Results Snapshot (Consolidated) - Mar'26 - YoY

YoY Growth in quarter ended Mar 2026 is 33.42% vs 7.67% in Mar 2025
YoY Growth in quarter ended Mar 2026 is 50.91% vs -69.27% in Mar 2025
Half Yearly Results Snapshot (Consolidated) - Sep'25
Growth in half year ended Sep 2025 is 16.70% vs -29.57% in Sep 2024
Growth in half year ended Sep 2025 is 10.05% vs -44.41% in Sep 2024
Nine Monthly Results Snapshot (Consolidated) - Dec'25
YoY Growth in nine months ended Dec 2025 is 7.97% vs -18.00% in Dec 2024

YoY Growth in nine months ended Dec 2025 is -26.15% vs -26.14% in Dec 2024
Annual Results Snapshot (Consolidated) - Mar'26
YoY Growth in year ended Mar 2026 is 14.90% vs -12.28% in Mar 2025
YoY Growth in year ended Mar 2026 is -15.00% vs -38.51% in Mar 2025
About Hindcon Chemicals Ltd

Company Coordinates


