
Compare Megastar Foods with Similar Stocks
Dashboard
Healthy long term growth as Net Sales has grown by an annual rate of 30.52%
With a growth in Net Profit of 28.57%, the company declared Very Positive results in Dec 25
With ROCE of 8.9, it has a Attractive valuation with a 1.8 Enterprise value to Capital Employed
Majority shareholders : Promoters
Market Beating Performance
Total Returns (Price + Dividend) 
Megastar Foods for the last several years.
Risk Adjusted Returns v/s
Returns Beta

News

Megastar Foods Ltd is Rated Buy
Megastar Foods Ltd is rated Buy by MarketsMOJO, with this rating last updated on 24 March 2026. While the rating change occurred on that date, the analysis and financial metrics discussed here reflect the stock's current position as of 27 March 2026, providing investors with the most up-to-date perspective on the company’s performance and outlook.
Read full news article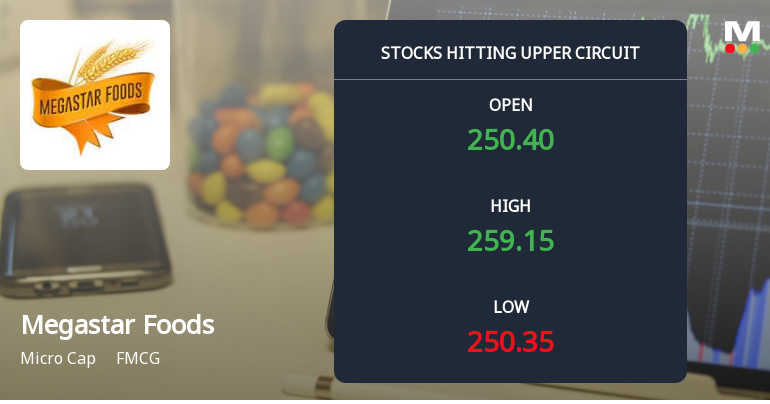
Megastar Foods Ltd Locks at Upper Circuit With 5% Gain — Buyers Queue, Sellers Absent
At Rs 259.79, the buying was done — not because demand dried up, but because the exchange wouldn't let the stock go any higher. Megastar Foods Ltd locked at its upper circuit of 5% on 24 Mar 2026, with buyers queuing and no sellers willing to part with shares.
Read full news article
Megastar Foods Ltd Hits Upper Circuit Amid Strong Buying Momentum
Megastar Foods Ltd, a micro-cap player in the FMCG sector, surged to hit its upper circuit limit on 16 Mar 2026, propelled by strong investor demand and sustained buying momentum. The stock closed at ₹248.00, marking a maximum daily gain of 4.77%, outperforming its sector and broader market indices.
Read full news article Announcements
Corporate Actions

No Upcoming Board Meetings

No Dividend history available

No Splits history available

No Bonus history available

No Rights history available
Quality key factors
Valuation key factors
Technicals key factors
 Technical Indicator Scale: Bearish, Mildly Bearish, Sideways, Mildly Bullish, Bullish Turned
 Shareholding Snapshot : Dec 2025
Shareholding Compare (%holding)
Promoters
None
Held by 0 Schemes
Held by 3 FIIs (1.06%)
Vikas Goel (22.96%)
Beeline Consultancy Services Private Limited (7.1%)
17.8%
Quarterly Results Snapshot (Consolidated) - Dec'25 - QoQ

QoQ Growth in quarter ended Dec 2025 is 2.35% vs 28.54% in Sep 2025
QoQ Growth in quarter ended Dec 2025 is 28.57% vs 49.69% in Sep 2025
Half Yearly Results Snapshot (Consolidated) - Sep'25

Growth in half year ended Sep 2025 is 73.12% vs 1.41% in Sep 2024
Growth in half year ended Sep 2025 is 102.58% vs -52.80% in Sep 2024
Nine Monthly Results Snapshot (Consolidated) - Dec'25
YoY Growth in nine months ended Dec 2025 is 64.90% vs 10.41% in Dec 2024
YoY Growth in nine months ended Dec 2025 is 192.47% vs -56.31% in Dec 2024
Annual Results Snapshot (Consolidated) - Mar'25
YoY Growth in year ended Mar 2025 is 31.31% vs -9.62% in Mar 2024
YoY Growth in year ended Mar 2025 is -40.03% vs -37.30% in Mar 2024
About Megastar Foods Ltd

Company Coordinates


