
Compare Latteys Industri with Similar Stocks
Dashboard
Healthy long term growth as Net Sales has grown by an annual rate of 35.51%
With a growth in Net Profit of 49.46%, the company declared Outstanding results in Mar 26
With ROCE of 13.2, it has a Expensive valuation with a 3.3 Enterprise value to Capital Employed
Majority shareholders : Promoters
Below par performance in long term as well as near term
Stock DNA
Compressors, Pumps & Diesel Engines
INR 130 Cr (Micro Cap)
35.00
34
0.00%
0.91
15.19%
5.33
Total Returns (Price + Dividend) 
Latteys Industri for the last several years.
Risk Adjusted Returns v/s
Returns Beta

News

Latteys Industries Ltd is Rated Hold
Latteys Industries Ltd is rated 'Hold' by MarketsMOJO, with this rating last updated on 26 May 2026. However, the analysis and financial metrics discussed here reflect the stock's current position as of 16 June 2026, providing investors with an up-to-date view of the company’s performance and outlook.
Read full news article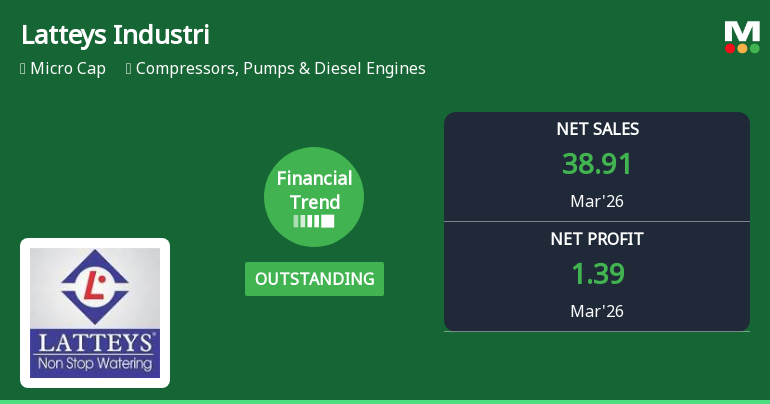
Latteys Industries Ltd Reports Very Positive Financial Trend Amid Market Challenges
Latteys Industries Ltd has demonstrated a marked improvement in its financial performance for the quarter ended March 2026, prompting an upgrade in its financial trend rating from outstanding to very positive. The company posted record quarterly figures across key metrics, signalling robust operational execution despite a challenging market environment.
Read full news article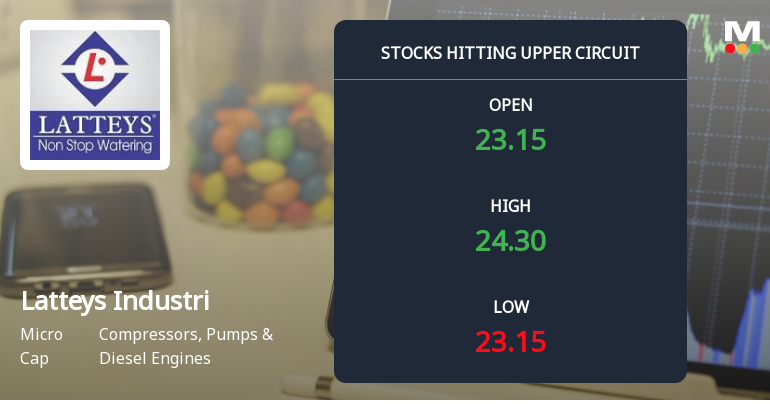
Latteys Industries Ltd Locks at Upper Circuit With 5% Gain — Buyers Queue, Sellers Absent
At Rs 24.30, the buying was done — not because demand dried up, but because the exchange wouldn't let the stock go any higher. Latteys Industries Ltd locked at its upper circuit of 5% on 1 Jun 2026, with buyers queuing and no sellers willing to part with shares.
Read full news article Announcements
Latteys Industries Limited - Updates
22-Oct-2019 | Source : NSELatteys Industries Limited has informed the Exchange regarding 'Declaration with respect to Non - Applicability of Corporate Governance under Regulation 27(2)'.
Latteys Industries Limited - Updates
16-Oct-2019 | Source : NSELatteys Industries Limited has informed the Exchange regarding ''Certificate pursuant to Regulation 74(5) of SEBI (Depositories and Participants) Regulation, 2018, for the quarter ended September 30, 2019''.
Corporate Actions

No Upcoming Board Meetings

No Dividend history available

Latteys Industries Ltd has announced 2:10 stock split, ex-date: 10 Feb 23

Latteys Industries Ltd has announced 3:2 bonus issue, ex-date: 12 Oct 22

No Rights history available
Quality key factors
Valuation key factors
Technicals key factors
 Technical Indicator Scale: Bearish, Mildly Bearish, Sideways, Mildly Bullish, Bullish Turned
 Shareholding Snapshot : Mar 2026
Shareholding Compare (%holding)
Promoters
None
Held by 0 Schemes
Held by 0 FIIs
Kapoor Chand Garg (63.4%)
None
26.47%
Quarterly Results Snapshot (Consolidated) - Mar'26 - QoQ

QoQ Growth in quarter ended Mar 2026 is 14.71% vs 65.54% in Dec 2025
QoQ Growth in quarter ended Mar 2026 is 47.87% vs 62.07% in Dec 2025
Half Yearly Results Snapshot (Consolidated) - Sep'25

Growth in half year ended Sep 2025 is 14.59% vs 13.56% in Sep 2024
Growth in half year ended Sep 2025 is 13.89% vs -6.90% in Sep 2024
Nine Monthly Results Snapshot (Consolidated) - Dec'25
YoY Growth in nine months ended Dec 2025 is 39.66% vs 20.43% in Dec 2024
YoY Growth in nine months ended Dec 2025 is 64.39% vs -0.75% in Dec 2024
Annual Results Snapshot (Consolidated) - Mar'26
YoY Growth in year ended Mar 2026 is 45.61% vs 26.11% in Mar 2025
YoY Growth in year ended Mar 2026 is 96.69% vs 21.48% in Mar 2025
About Latteys Industries Ltd

Company Coordinates


