
Compare Solara Active with Similar Stocks
Dashboard
Weak Long Term Fundamental Strength with a -20.67% CAGR growth in Operating Profits over the last 5 years
- Low ability to service debt as the company has a high Debt to EBITDA ratio of 3.68 times
- The company has been able to generate a Return on Equity (avg) of 0.01% signifying low profitability per unit of shareholders funds
Positive results in Mar 26
With ROCE of 4.6, it has a Attractive valuation with a 1.8 Enterprise value to Capital Employed
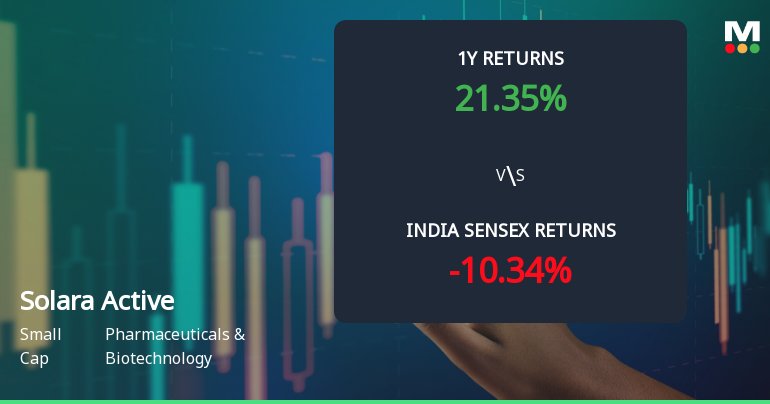
Market Beating performance in long term as well as near term
Stock DNA
Pharmaceuticals & Biotechnology
INR 2,701 Cr (Small Cap)
NA (Loss Making)
34
0.00%
0.51
-0.12%
2.20
Total Returns (Price + Dividend) 
Latest dividend: 3 per share ex-dividend date: Aug-18-2021
Risk Adjusted Returns v/s
Returns Beta

News
Solara Active Pharma Sciences Ltd Shows Mixed Technical Signals Amid Price Momentum Shift
Solara Active Pharma Sciences Ltd has experienced a notable shift in its technical momentum, moving from a mildly bearish stance to a sideways trend. Despite a strong day change of 9.93%, the stock’s technical indicators present a complex picture, with bullish signals on weekly charts contrasting with bearish monthly trends. This nuanced technical landscape warrants a detailed analysis for investors navigating the Pharmaceuticals & Biotechnology sector.
Read full news article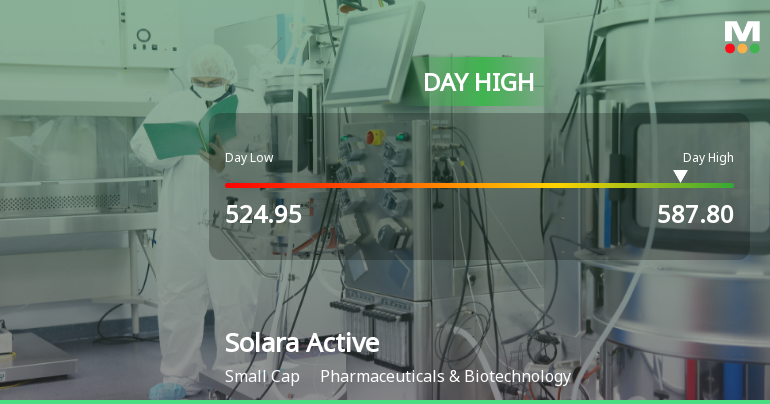
Solara Active Pharma Sciences Ltd Surges 8.7% to Day's High of Rs 577.45 — Outperforms Sector by 8.98 Percentage Points
The Sensex edged up 0.38% on 9 Jun 2026, but Solara Active Pharma Sciences Ltd surged 8.71%, significantly outpacing its Pharmaceuticals & Biotechnology sector by nearly 9 percentage points. This sharp single-session gain rewrites the short-term narrative for the small-cap stock, which also touched an intraday high of Rs 577.45, marking a highly volatile trading day with a 7.04% intraday range.
Read full news article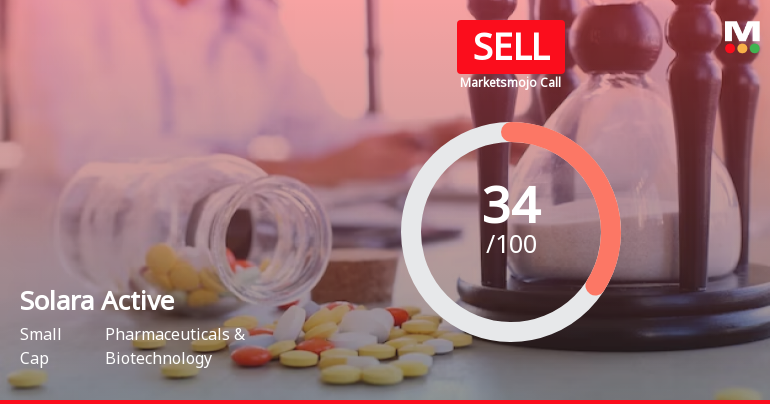
Solara Active Pharma Sciences Ltd is Rated Sell
Solara Active Pharma Sciences Ltd is rated 'Sell' by MarketsMOJO, with this rating last updated on 15 May 2026. However, the analysis and financial metrics discussed here reflect the stock's current position as of 03 June 2026, providing investors with an up-to-date view of the company’s fundamentals, returns, and market standing.
Read full news article Announcements
Solara Active Pharma Sciences Limited - Press Release
09-Dec-2019 | Source : NSESolara Active Pharma Sciences Limited has informed the Exchange regarding a press release dated December 09, 2019, titled "Appointment of Mr. Bharath R. Sesha Chief Executive Officer.".
Solara Active Pharma Sciences Limited - Allotment of ESOP/ESPS
03-Dec-2019 | Source : NSESolara Active Pharma Sciences Limited has informed the Exchange regarding allotment of 248000 Equity Shares under ESOP
Solara Active Pharma Sciences Limited - Other General Purpose
21-Nov-2019 | Source : NSESolara Active Pharma Sciences Limited has informed the Exchange that Disclosure of Related Party Transactions pursuant to Regulation 23(9) of SEBI (Listing Obligations and Disclosure Requirements) Regulations, 2015
Corporate Actions

No Upcoming Board Meetings

Solara Active Pharma Sciences Ltd has declared 30% dividend, ex-date: 18 Aug 21

No Splits history available

No Bonus history available

Solara Active Pharma Sciences Ltd has announced 1:3 rights issue, ex-date: 15 May 24
Quality key factors
Valuation key factors
Technicals key factors
 Technical Indicator Scale: Bearish, Mildly Bearish, Sideways, Mildly Bullish, Bullish Turned
 Shareholding Snapshot : May 2026
Shareholding Compare (%holding)
Non Institution
36.5742
Held by 3 Schemes (1.16%)
Held by 52 FIIs (11.33%)
Devicam Capital Llp (15.49%)
Authum Investment And Infrastructure Limited (3.79%)
25.15%
Quarterly Results Snapshot (Consolidated) - Mar'26 - QoQ

QoQ Growth in quarter ended Mar 2026 is 10.97% vs 11.31% in Dec 2025

QoQ Growth in quarter ended Mar 2026 is 155.08% vs -72.57% in Dec 2025
Half Yearly Results Snapshot (Consolidated) - Sep'25
Growth in half year ended Sep 2025 is -10.94% vs -8.63% in Sep 2024
Growth in half year ended Sep 2025 is 107.71% vs 85.15% in Sep 2024
Nine Monthly Results Snapshot (Consolidated) - Dec'25
YoY Growth in nine months ended Dec 2025 is -2.88% vs -1.51% in Dec 2024
YoY Growth in nine months ended Dec 2025 is -744.32% vs 100.85% in Dec 2024
Annual Results Snapshot (Consolidated) - Mar'26
YoY Growth in year ended Mar 2026 is 6.64% vs -0.40% in Mar 2025
YoY Growth in year ended Mar 2026 is -1,472.22% vs 100.10% in Mar 2025
About Solara Active Pharma Sciences Ltd

Company Coordinates


