
Compare Aaron Industries with Similar Stocks
Stock DNA
Industrial Manufacturing
INR 261 Cr (Micro Cap)
38.00
37
0.49%
0.51
13.97%
5.33
Total Returns (Price + Dividend) 
Latest dividend: 1.2 per share ex-dividend date: Aug-08-2025
Risk Adjusted Returns v/s
Returns Beta

News

Aaron Industries Ltd is Rated Sell
Aaron Industries Ltd is rated Sell by MarketsMOJO. This rating was last updated on 01 Sep 2025, reflecting a shift from the previous Hold status. However, the analysis below is based on the company’s current position as of 11 June 2026, incorporating the latest fundamentals, returns, and financial metrics to provide investors with an up-to-date perspective.
Read full news article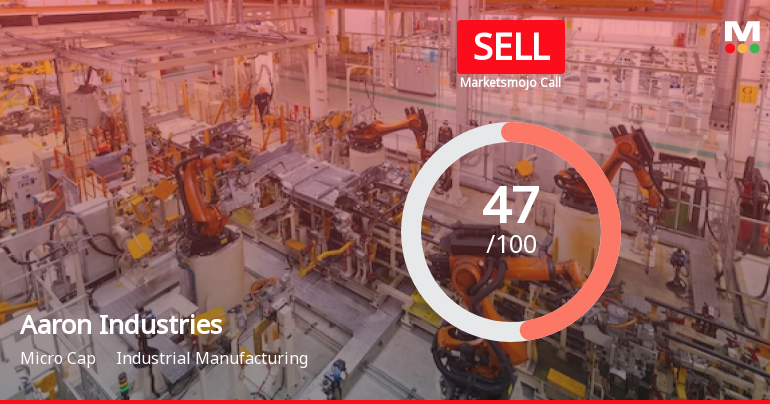
Aaron Industries Ltd is Rated Sell
Aaron Industries Ltd is rated Sell by MarketsMOJO, with this rating last updated on 01 Sep 2025. However, the analysis and financial metrics discussed here reflect the stock’s current position as of 27 May 2026, providing investors with an up-to-date view of the company’s fundamentals, returns, and market standing.
Read full news article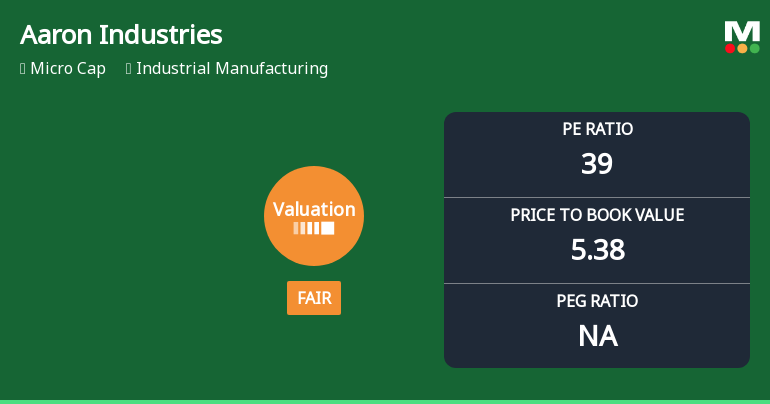
Aaron Industries Ltd Valuation Shifts: From Expensive to Fair Amid Market Pressure
Aaron Industries Ltd, a micro-cap player in the industrial manufacturing sector, has recently undergone a notable shift in its valuation parameters, moving from an expensive to a fair valuation grade. This change comes amid a challenging market environment and a significant decline in the stock price, prompting investors to reassess its price attractiveness relative to historical levels and peer companies.
Read full news article Announcements
Aaron Industries Limited - Investor Presentation
14-Nov-2019 | Source : NSEAaron Industries Limited has informed the Exchange regarding Investor Presentation
Aaron Industries Limited - Outcome of Board Meeting
13-Nov-2019 | Source : NSEAaron Industries Limited has informed the Exchange regarding Board meeting held on November 12, 2019.
Corporate Actions

No Upcoming Board Meetings

Aaron Industries Ltd has declared 12% dividend, ex-date: 08 Aug 25

No Splits history available

Aaron Industries Ltd has announced 1:1 bonus issue, ex-date: 25 Aug 25

No Rights history available
Quality key factors
Valuation key factors
Technicals key factors
 Technical Indicator Scale: Bearish, Mildly Bearish, Sideways, Mildly Bullish, Bullish Turned
 Shareholding Snapshot : Mar 2026
Shareholding Compare (%holding)
Promoters
None
Held by 0 Schemes
Held by 0 FIIs
Amar Chinubhai Doshi (25.77%)
None
24.96%
Quarterly Results Snapshot (Standalone) - Mar'26 - QoQ

QoQ Growth in quarter ended Mar 2026 is 17.80% vs 4.32% in Dec 2025

QoQ Growth in quarter ended Mar 2026 is 14.85% vs 45.32% in Dec 2025
Half Yearly Results Snapshot (Standalone) - Sep'25
Growth in half year ended Sep 2025 is 16.91% vs 20.15% in Sep 2024
Growth in half year ended Sep 2025 is -33.60% vs 31.32% in Sep 2024
Nine Monthly Results Snapshot (Standalone) - Dec'25
YoY Growth in nine months ended Dec 2025 is 20.20% vs 21.88% in Dec 2024
YoY Growth in nine months ended Dec 2025 is -18.58% vs 36.91% in Dec 2024
Annual Results Snapshot (Standalone) - Mar'26
YoY Growth in year ended Mar 2026 is 18.07% vs 23.25% in Mar 2025
YoY Growth in year ended Mar 2026 is -17.48% vs 30.17% in Mar 2025
About Aaron Industries Ltd


