
Compare Rajshree Polypac with Similar Stocks
Dashboard
Weak Long Term Fundamental Strength with an average Return on Capital Employed (ROCE) of 8.62%
- Poor long term growth as Net Sales has grown by an annual rate of 13.73% and Operating profit at 15.90% over the last 5 years
- Low ability to service debt as the company has a high Debt to EBITDA ratio of 2.79 times
With a growth in Net Profit of 190%, the company declared Very Positive results in Mar 26
With ROCE of 9, it has a Very Attractive valuation with a 0.9 Enterprise value to Capital Employed
Majority shareholders : Non Institution
Below par performance in long term as well as near term
Stock DNA
Diversified consumer products
INR 163 Cr (Micro Cap)
9.00
36
0.00%
0.66
9.56%
0.90
Total Returns (Price + Dividend) 
Latest dividend: 0.165 per share ex-dividend date: Aug-24-2023
Risk Adjusted Returns v/s
Returns Beta

News
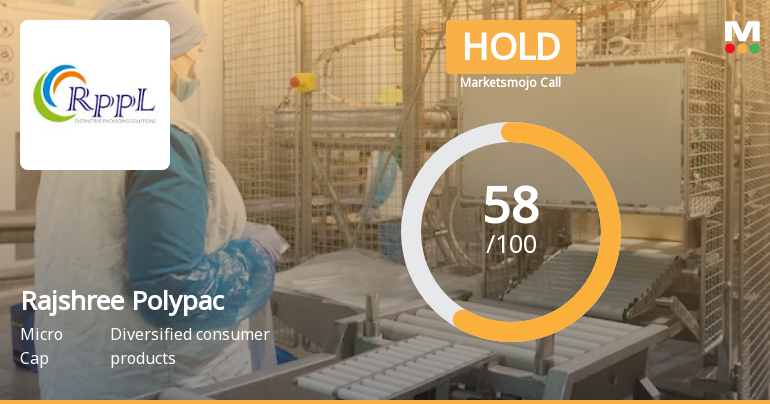
Rajshree Polypack Ltd is Rated Hold by MarketsMOJO
Rajshree Polypack Ltd is rated 'Hold' by MarketsMOJO, with this rating last updated on 15 June 2026. While the rating was revised on that date, the analysis and financial metrics discussed here reflect the stock's current position as of 26 June 2026, providing investors with an up-to-date perspective on the company’s performance and outlook.
Read full news article
Rajshree Polypack Ltd is Rated Sell
Rajshree Polypack Ltd is rated 'Sell' by MarketsMOJO, with this rating last updated on 08 June 2026. However, the analysis and financial metrics discussed here reflect the stock's current position as of 15 June 2026, providing investors with an up-to-date perspective on the company’s fundamentals, valuation, financial trends, and technical outlook.
Read full news article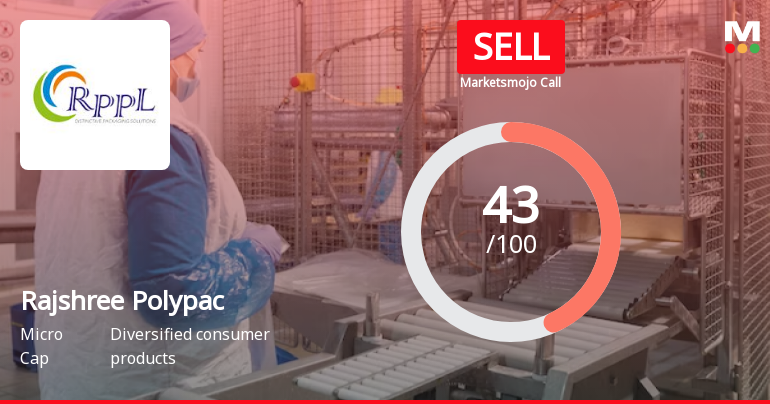
Rajshree Polypack Ltd is Rated Sell by MarketsMOJO
Rajshree Polypack Ltd is rated 'Sell' by MarketsMOJO, with this rating last updated on 01 April 2026. However, the analysis and financial metrics discussed here reflect the stock's current position as of 01 June 2026, providing investors with an up-to-date perspective on the company’s performance and outlook.
Read full news article Announcements
Rajshreepolypack Limited - Reply to Clarification- Financial results
22-Nov-2019 | Source : NSERajshreepolypack Limitedpolypack Limited for the quarter ended 30-Sep-2019 with respect to Regulation 33 of the SEBI (Listing Obligations and Disclosure Requirements) Regulations, 2015.
Rajshreepolypack Limited - Investor Presentation
18-Nov-2019 | Source : NSERajshreepolypack Limited has informed the Exchange regarding Investor Presentation
Rajshreepolypack Limited - Analysts/Institutional Investor Meet/Con. Call Updates
15-Nov-2019 | Source : NSERajshreepolypack Limited has informed the Exchange regarding Analysts/Institutional Investor Meet/Con. Call Updates
Corporate Actions

No Upcoming Board Meetings

Rajshree Polypack Ltd has declared 5% dividend, ex-date: 24 Aug 23

Rajshree Polypack Ltd has announced 5:10 stock split, ex-date: 17 Sep 24

Rajshree Polypack Ltd has announced 2:1 bonus issue, ex-date: 26 Feb 24

No Rights history available
Quality key factors
Valuation key factors
Technicals key factors
 Technical Indicator Scale: Bearish, Mildly Bearish, Sideways, Mildly Bullish, Bullish Turned
 Shareholding Snapshot : Mar 2026
Shareholding Compare (%holding)
Non Institution
None
Held by 0 Schemes
Held by 0 FIIs
Ramswaroop Radheshyam Thard (15.94%)
Wifag-polytype Holding Ag (7.14%)
41.0%
Quarterly Results Snapshot (Consolidated) - Mar'26 - QoQ

QoQ Growth in quarter ended Mar 2026 is 27.93% vs -17.14% in Dec 2025
QoQ Growth in quarter ended Mar 2026 is 190.00% vs -52.17% in Dec 2025
Half Yearly Results Snapshot (Consolidated) - Sep'25

Growth in half year ended Sep 2025 is 1.18% vs 19.11% in Sep 2024
Growth in half year ended Sep 2025 is 65.33% vs 29.31% in Sep 2024
Nine Monthly Results Snapshot (Consolidated) - Dec'25
YoY Growth in nine months ended Dec 2025 is 0.37% vs 16.91% in Dec 2024
YoY Growth in nine months ended Dec 2025 is 152.44% vs -34.80% in Dec 2024
Annual Results Snapshot (Consolidated) - Mar'26
YoY Growth in year ended Mar 2026 is 0.74% vs 20.17% in Mar 2025
YoY Growth in year ended Mar 2026 is 116.71% vs -7.87% in Mar 2025
About Rajshree Polypack Ltd

Company Coordinates


