
Compare Osia Hyper Reta. with Similar Stocks
Dashboard
Company's ability to service its debt is weak with a poor EBIT to Interest (avg) ratio of 1.76
- Company's ability to service its debt is weak with a poor EBIT to Interest (avg) ratio of 1.76
Flat results in Dec 25
Reducing Promoter Confidence
Below par performance in long term as well as near term
Total Returns (Price + Dividend) 
Osia Hyper Reta. for the last several years.
Risk Adjusted Returns v/s
Returns Beta

News

Osia Hyper Retail Ltd is Rated Sell
Osia Hyper Retail Ltd is rated 'Sell' by MarketsMOJO, with this rating last updated on 21 Nov 2025. However, the analysis and financial metrics discussed here reflect the stock's current position as of 29 June 2026, providing investors with an up-to-date view of the company’s fundamentals, valuation, financial trends, and technical outlook.
Read full news article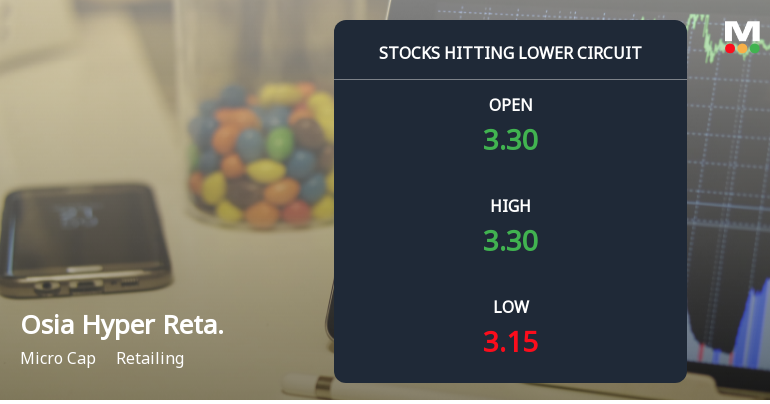
Osia Hyper Retail Ltd Locks at Lower Circuit With 2.42% Loss — Sellers Queue, No Buyers in Sight
At Rs 3.15, sellers were still queuing — but there were no buyers willing to take the other side. Osia Hyper Retail Ltd locked at its lower circuit of 5% on 29 Jun 2026, with unfilled sell orders and a frozen price, signalling persistent selling pressure in a micro-cap stock with limited liquidity.
Read full news article
Osia Hyper Retail Ltd Locks at Lower Circuit With 4.10% Loss — Sellers Queue, No Buyers in Sight
At Rs 3.02, Osia Hyper Retail Ltd locked at its lower circuit on 24 Jun 2026, reflecting a 4.10% decline within a 5% price band. Sellers were lined up to exit, but the absence of buyers froze the price, creating unfilled supply and a trading halt at the floor price.
Read full news article Announcements
Osia Hyper Retail Limited - Financial Results Updates
18-Nov-2019 | Source : NSEOsia Hyper Retail Limited has informed the Exchange regarding ADDENDUM OF FINANCIAL RESULT SUBMITTED ON NOVEMBER 14, 2019
Osia Hyper Retail Limited - Statement of deviation(s) or variation(s) under Reg. 32
31-Oct-2019 | Source : NSEOsia Hyper Retail Limited has informed the Exchange regarding Statement of deviation(s) or variation(s) under Reg. 32 of SEBI (LODR) Regulations 2015
Corporate Actions

No Upcoming Board Meetings

No Dividend history available

Osia Hyper Retail Ltd has announced 1:10 stock split, ex-date: 13 Mar 23

Osia Hyper Retail Ltd has announced 3:5 bonus issue, ex-date: 20 Jun 22

No Rights history available
Quality key factors
Valuation key factors
Technicals key factors
 Technical Indicator Scale: Bearish, Mildly Bearish, Sideways, Mildly Bullish, Bullish Turned
 Shareholding Snapshot : Mar 2026
Shareholding Compare (%holding)
Non Institution
None
Held by 0 Schemes
Held by 2 FIIs (0.47%)
Kavita Dhirendrakumar Chopra (20.53%)
Jay Vasantbhai Turakhiya (3.33%)
57.74%
Quarterly Results Snapshot (Standalone) - Dec'25 - QoQ

QoQ Growth in quarter ended Dec 2025 is 2.66% vs 14.26% in Sep 2025

QoQ Growth in quarter ended Dec 2025 is -15.29% vs -36.57% in Sep 2025
Half Yearly Results Snapshot (Standalone) - Sep'25
Growth in half year ended Sep 2025 is 2.89% vs 42.58% in Sep 2024
Growth in half year ended Sep 2025 is 31.80% vs 17.16% in Sep 2024
Nine Monthly Results Snapshot (Standalone) - Dec'25
YoY Growth in nine months ended Dec 2025 is -0.40% vs 30.67% in Dec 2024
YoY Growth in nine months ended Dec 2025 is -8.01% vs 39.46% in Dec 2024
Annual Results Snapshot (Standalone) - Mar'25
YoY Growth in year ended Mar 2025 is 24.70% vs 54.91% in Mar 2024
YoY Growth in year ended Mar 2025 is 6.67% vs 92.63% in Mar 2024
About Osia Hyper Retail Ltd

Company Coordinates


