
Compare DC Infotech with Similar Stocks
Dashboard
High Management Efficiency with a high ROCE of 25.18%
Strong ability to service debt as the company has a low Debt to EBITDA ratio of 1.29 times
Healthy long term growth as Operating profit has grown by an annual rate 44.87%
Positive results in Dec 25
With ROCE of 25.6, it has a Fair valuation with a 4.5 Enterprise value to Capital Employed
Majority shareholders : Promoters
Underperformed the market in the last 1 year
Stock DNA
IT - Hardware
INR 417 Cr (Micro Cap)
22.00
48
0.00%
0.38
26.67%
5.81
Total Returns (Price + Dividend) 
DC Infotech for the last several years.
Risk Adjusted Returns v/s
Returns Beta

News

DC Infotech & Communication Ltd is Rated Hold
DC Infotech & Communication Ltd is rated 'Hold' by MarketsMOJO, with this rating last updated on 10 November 2025. However, the analysis and financial metrics discussed here reflect the stock's current position as of 27 February 2026, providing investors with an up-to-date view of the company’s fundamentals, returns, and market performance.
Read full news article
DC Infotech & Communication Ltd is Rated Hold
DC Infotech & Communication Ltd is rated 'Hold' by MarketsMOJO, a rating that was last updated on 10 November 2025. However, the analysis and financial metrics discussed here reflect the company’s current position as of 16 February 2026, providing investors with an up-to-date view of the stock’s fundamentals, returns, and technical outlook.
Read full news article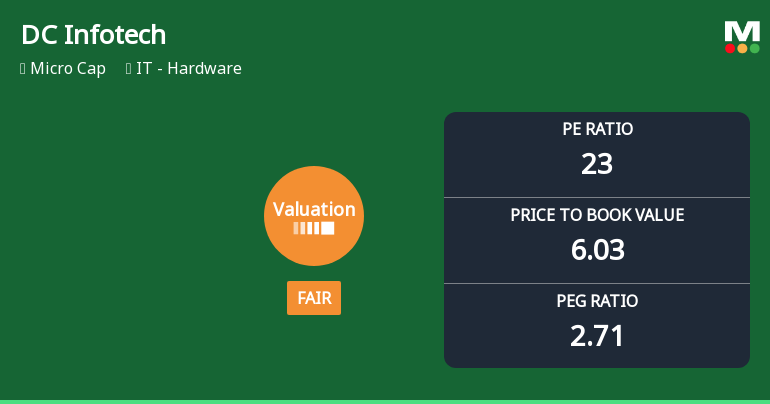
DC Infotech & Communication Ltd: Valuation Shifts Signal Renewed Investor Interest
DC Infotech & Communication Ltd has witnessed a notable shift in its valuation parameters, moving from an attractive to a fair valuation grade amid robust price gains and improving fundamentals. This article analyses the recent changes in key valuation metrics such as the price-to-earnings (P/E) and price-to-book value (P/BV) ratios, comparing them with historical averages and peer benchmarks to assess the stock’s price attractiveness in the current market environment.
Read full news article Announcements
Corporate Actions

No Upcoming Board Meetings

No Dividend history available

No Splits history available

DC Infotech & Communication Ltd has announced 1:1 bonus issue, ex-date: 10 Jan 22

No Rights history available
Quality key factors
Valuation key factors
Technicals key factors
 Technical Indicator Scale: Bearish, Mildly Bearish, Sideways, Mildly Bullish, Bullish Turned
 Shareholding Snapshot : Dec 2025
Shareholding Compare (%holding)
Promoters
None
Held by 0 Schemes
Held by 2 FIIs (1.14%)
Chetankumar H Timbadia (21.08%)
Purvi Ketan Patel (3.23%)
29.95%
Quarterly Results Snapshot (Standalone) - Dec'25 - QoQ

QoQ Growth in quarter ended Dec 2025 is 27.61% vs 3.60% in Sep 2025
QoQ Growth in quarter ended Dec 2025 is 29.34% vs 23.70% in Sep 2025
Half Yearly Results Snapshot (Standalone) - Sep'25

Growth in half year ended Sep 2025 is 21.18% vs 22.52% in Sep 2024
Growth in half year ended Sep 2025 is 34.27% vs 28.63% in Sep 2024
Nine Monthly Results Snapshot (Standalone) - Dec'25
YoY Growth in nine months ended Dec 2025 is 29.84% vs 25.56% in Dec 2024
YoY Growth in nine months ended Dec 2025 is 44.06% vs 45.48% in Dec 2024
Annual Results Snapshot (Standalone) - Mar'25
YoY Growth in year ended Mar 2025 is 20.91% vs 27.81% in Mar 2024
YoY Growth in year ended Mar 2025 is 24.89% vs 63.98% in Mar 2024
About DC Infotech & Communication Ltd

Company Coordinates


