[
{
"link": "quarterly",
"btn_text": "All Quarterly Results",
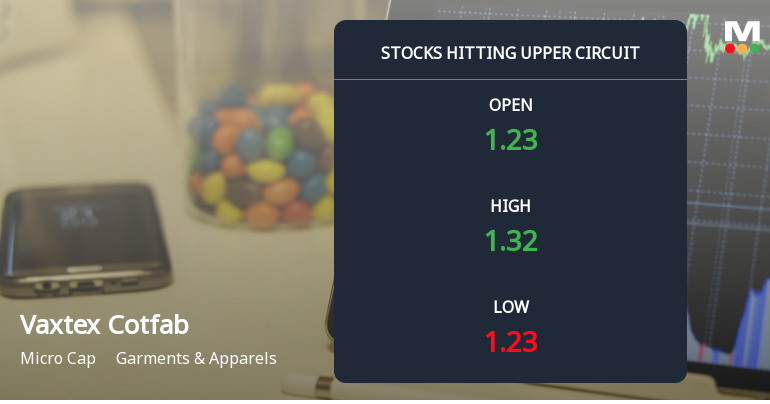
"header": "Quarterly Results Snapshot (Standalone) - Mar'26 - QoQ",
"rhs": [
{
"prefix": "Net Sales ",
"suffix": "QoQ Growth in quarter ended Mar 2026 is -100.00% vs 287.77% in Dec 2025",
"dir": -1
},
{
"prefix": "Standalone Net Profit ",
"suffix": "QoQ Growth in quarter ended Mar 2026 is -80.00% vs 592.98% in Dec 2025",
"dir": -1
}
],
"table": {
"header": [
"Mar'26",
"Dec'25",
"Change(%)"
],
"body": [
{
"field": "Net Sales",
"val1": "0.00",
"val2": "8.88",
"chgp": "-100.00%",
"chgp_class": "negative"
},
{
"field": "Operating Profit (PBDIT) excl Other Income",
"val1": "-0.08",
"val2": "2.31",
"chgp": "-103.46%",
"chgp_class": "negative"
},
{
"field": "Interest",
"val1": "0.02",
"val2": "0.02",
"chgp": "",
"chgp_class": "neutral"
},
{
"field": "Exceptional Items",
"val1": "0.00",
"val2": "0.00",
"chgp": "",
"chgp_class": "neutral"
},
{
"field": "Standalone Net Profit",
"val1": "0.79",
"val2": "3.95",
"chgp": "-80.00%",
"chgp_class": "negative"
},
{
"field": "Operating Profit Margin (Excl OI)",
"val1": "0.00%",
"val2": "26.01%",
"chgp": "-26.01%",
"chgp_class": "negative"
}
]
}
},
{
"link": "half-yearly",
"btn_text": "All Half Yearly Results",
"header": "Half Yearly Results Snapshot (Standalone) - Sep'25",
"rhs": [
{
"prefix": "Net Sales ",
"suffix": " Growth in half year ended Sep 2025 is 0.00% vs -100.00% in Sep 2024",
"dir": 1
},
{
"prefix": "Standalone Net Profit ",
"suffix": " Growth in half year ended Sep 2025 is 2,075.00% vs -109.09% in Sep 2024",
"dir": 1
}
],
"table": {
"header": [
"Sep'25",
"Sep'24",
"Change(%)"
],
"body": [
{
"field": "Net Sales",
"val1": "2.29",
"val2": "0.00",
"chgp": "",
"chgp_class": "neutral"
},
{
"field": "Operating Profit (PBDIT) excl Other Income",
"val1": "-0.33",
"val2": "-0.03",
"chgp": "-1,000.00%",
"chgp_class": "negative"
},
{
"field": "Interest",
"val1": "0.04",
"val2": "0.03",
"chgp": "33.33%",
"chgp_class": "negative"
},
{
"field": "Exceptional Items",
"val1": "0.00",
"val2": "0.00",
"chgp": "",
"chgp_class": "neutral"
},
{
"field": "Standalone Net Profit",
"val1": "0.79",
"val2": "-0.04",
"chgp": "2,075.00%",
"chgp_class": "positive"
},
{
"field": "Operating Profit Margin (Excl OI)",
"val1": "-14.41%",
"val2": "0.00%",
"chgp": "-14.41%",
"chgp_class": "negative"
}
]
}
},
{
"link": "nine-monthly",
"btn_text": "All Nine Monthly Results",
"header": "Nine Monthly Results Snapshot (Standalone) - Dec'25",
"rhs": [
{
"prefix": "Net Sales ",
"suffix": "YoY Growth in nine months ended Dec 2025 is 0.00% vs -100.00% in Dec 2024",
"dir": 1
},
{
"prefix": "Standalone Net Profit ",
"suffix": "YoY Growth in nine months ended Dec 2025 is 1,202.33% vs 94.75% in Dec 2024",
"dir": 1
}
],
"table": {
"header": [
"Dec'25",
"Dec'24",
"Change(%)"
],
"body": [
{
"field": "Net Sales",
"val1": "11.17",
"val2": "0.00",
"chgp": "",
"chgp_class": "neutral"
},
{
"field": "Operating Profit (PBDIT) excl Other Income",
"val1": "1.98",
"val2": "-0.40",
"chgp": "595.00%",
"chgp_class": "positive"
},
{
"field": "Interest",
"val1": "0.06",
"val2": "0.05",
"chgp": "20.00%",
"chgp_class": "negative"
},
{
"field": "Exceptional Items",
"val1": "0.00",
"val2": "0.00",
"chgp": "",
"chgp_class": "neutral"
},
{
"field": "Standalone Net Profit",
"val1": "4.74",
"val2": "-0.43",
"chgp": "1,202.33%",
"chgp_class": "positive"
},
{
"field": "Operating Profit Margin (Excl OI)",
"val1": "17.73%",
"val2": "0.00%",
"chgp": "17.73%",
"chgp_class": "positive"
}
]
}
},
{
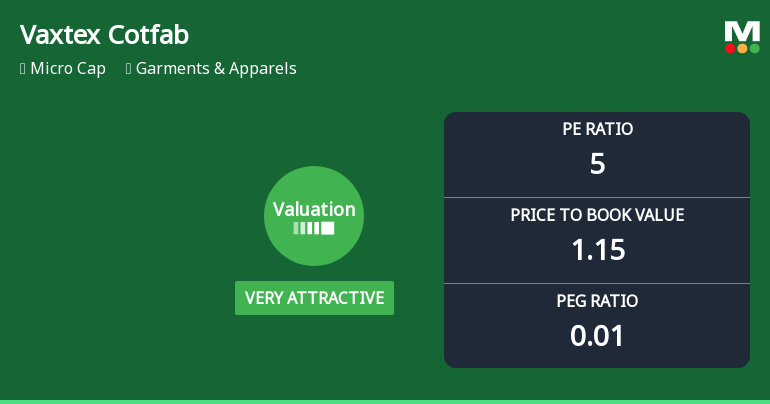
"link": "annual",
"btn_text": "All Annual Results",
"header": "Annual Results Snapshot (Standalone) - Mar'26",
"rhs": [
{
"prefix": "Net Sales ",
"suffix": "YoY Growth in year ended Mar 2026 is 112.76% vs -68.41% in Mar 2025",
"dir": 1
},
{
"prefix": "Standalone Net Profit ",
"suffix": "YoY Growth in year ended Mar 2026 is 528.41% vs 109.97% in Mar 2025",
"dir": 1
}
],
"table": {
"header": [
"Mar'26",
"Mar'25",
"Change(%)"
],
"body": [
{
"field": "Net Sales",
"val1": "11.17",
"val2": "5.25",
"chgp": "112.76%",
"chgp_class": "positive"
},
{
"field": "Operating Profit (PBDIT) excl Other Income",
"val1": "1.90",
"val2": "-0.51",
"chgp": "472.55%",
"chgp_class": "positive"
},
{
"field": "Interest",
"val1": "0.07",
"val2": "0.11",
"chgp": "-36.36%",
"chgp_class": "positive"
},
{
"field": "Exceptional Items",
"val1": "0.00",
"val2": "0.00",
"chgp": "",
"chgp_class": "neutral"
},
{
"field": "Standalone Net Profit",
"val1": "5.53",
"val2": "0.88",
"chgp": "528.41%",
"chgp_class": "positive"
},
{
"field": "Operating Profit Margin (Excl OI)",
"val1": "17.01%",
"val2": "-9.71%",
"chgp": "26.72%",
"chgp_class": "positive"
}
]
}
}
]Operating Profit (PBDIT) excl Other Income
-0.08
2.31
Exceptional Items
0.00
0.00
Standalone Net Profit
0.79
3.95
Operating Profit Margin (Excl OI)
0.00%
26.01%
Values in Rs Cr.

Net Sales
QoQ Growth in quarter ended Mar 2026 is -100.00% vs 287.77% in Dec 2025
Standalone Net Profit
QoQ Growth in quarter ended Mar 2026 is -80.00% vs 592.98% in Dec 2025
Operating Profit (PBDIT) excl Other Income
-0.33
-0.03
Exceptional Items
0.00
0.00
Standalone Net Profit
0.79
-0.04
Operating Profit Margin (Excl OI)
-14.41%
0.00%
Values in Rs Cr.

Net Sales
Growth in half year ended Sep 2025 is 0.00% vs -100.00% in Sep 2024
Standalone Net Profit
Growth in half year ended Sep 2025 is 2,075.00% vs -109.09% in Sep 2024
Operating Profit (PBDIT) excl Other Income
1.98
-0.40
Exceptional Items
0.00
0.00
Standalone Net Profit
4.74
-0.43
Operating Profit Margin (Excl OI)
17.73%
0.00%
Values in Rs Cr.
Net Sales
YoY Growth in nine months ended Dec 2025 is 0.00% vs -100.00% in Dec 2024
Standalone Net Profit
YoY Growth in nine months ended Dec 2025 is 1,202.33% vs 94.75% in Dec 2024
Operating Profit (PBDIT) excl Other Income
1.90
-0.51
Exceptional Items
0.00
0.00
Standalone Net Profit
5.53
0.88
Operating Profit Margin (Excl OI)
17.01%
-9.71%
Values in Rs Cr.
Net Sales
YoY Growth in year ended Mar 2026 is 112.76% vs -68.41% in Mar 2025
Standalone Net Profit
YoY Growth in year ended Mar 2026 is 528.41% vs 109.97% in Mar 2025


 Technical Indicator Scale: Bearish, Mildly Bearish, Sideways, Mildly Bullish, Bullish Turned


