Rolex Rings

  • Market Cap: Small Cap
  • Industry: Auto Components & Equipments
  • ISIN: INE645S01024
  • NSEID: ROLEXRINGS
  • BSEID: 543325
INR
178.22
5.21 (3.01%)
BSENSE

Sep 03, 09:42 AM

BSE+NSE Vol: 3.8 lacs

  • Price Points
  • Score
  • Mojo Parameters
  • Total Return
  • News and Corporate Actions
  • Key factors
  • Shareholding
  • Financials
  • CompanyCV
stock-summaryPrice Point
High/Low

1Day

52 Week

Valuation
Technical
Day's Volume

CASH

3.8 lacs (84.35%) Volume

Shareholding (Jun 2026)

FII

5.40%

Held by 33 FIIs

DII

28.75%

Held by 36 DIIs

Promoter

52.24%

Why is Rolex Rings Ltd falling/rising?

03-Sep-2026

As of 02-Sep, Rolex Rings Ltd's stock price is falling to Rs 173.00, down 3.16%. This decline is due to underperformance in its sector, consecutive losses, decreased investor participation, and negative short-term trends despite strong long-term returns.

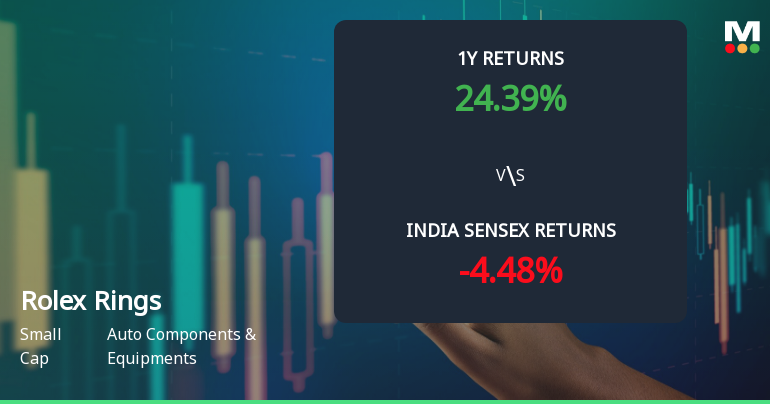
As of 02-Sep, Rolex Rings Ltd's stock price is falling, currently at Rs 173.00, reflecting a decrease of Rs 5.65 or 3.16%. This decline can be attributed to several factors. The stock has underperformed its sector by 1.84% today and has experienced consecutive losses over the last two days, totaling a drop of 4.2% in that period. Additionally, the stock reached an intraday low of Rs 171.8, which indicates significant selling pressure.<BR><BR>Investor participation has also decreased, with delivery volume falling by 26.25% compared to the five-day average, suggesting reduced interest from investors. Despite the stock's strong performance over the past month and year, with returns of 26.37% and 24.39% respectively, the recent short-term trends indicate a negative sentiment among investors. The stock's moving averages show it is above the longer-term averages (20, 50, 100, and 200 days) but below the 5-day moving average, which may signal a shift in momentum. Overall, these factors contribute to the current decline in Rolex Rings Ltd's stock price.

View full answer

Who are in the management team of Rolex Rings?

01-Sep-2026

The management team of Rolex Rings includes Chairman Manesh Dayashankar Madeka, Executive Directors Bhoutik and Mihir Rupeshkumar Madeka, and Independent Non-Executive Directors Pravinchandra Ratilal Dholakia, Jignasa Pravinchandra Mehta, and Ashit Ravishankar Vankani. They are responsible for the company's governance and strategic direction.

The management team of Rolex Rings includes the following key individuals:<BR><BR>1. **Manesh Dayashankar Madeka** - Chairman / Executive Director<BR>2. **Bhoutik Dayashankar Madeka** - Executive Director & Wholetime Director<BR>3. **Mihir Rupeshkumar Madeka** - Executive Director & Wholetime Director<BR>4. **Pravinchandra Ratilal Dholakia** - Independent Non-Executive Director<BR>5. **Jignasa Pravinchandra Mehta** - Independent Non-Executive Director<BR>6. **Ashit Ravishankar Vankani** - Independent Non-Executive Director<BR><BR>These individuals play significant roles in the governance and strategic direction of the company.

View full answer

What does Rolex Rings do?

01-Sep-2026

Rolex Rings Ltd is a small-cap company in the Auto Components & Equipments industry, established in 1977, with recent quarterly net sales of ₹304 Cr and a net profit of ₹60 Cr. Key financial metrics include a P/E ratio of 23.00 and a market capitalization of ₹4,795 Cr.

Overview:<BR>Rolex Rings Ltd is a company operating in the Auto Components & Equipments industry, categorized as a Small Cap entity.<BR><BR>History:<BR>Rolex Rings Limited commenced its operations in 1977-78 under a partnership by its promoters, Rupesh Dayashankar Madeka and Manesh Dayashankar Madeka. The partnership deed was formalized on April 26, 1988, in Rajkot, with Jiten Dayashankar Madeka later joining as a partner. The latest quarterly results reported net sales and profit for June 2026.<BR><BR>Financial Snapshot:<BR>Net Sales: 304 Cr (Quarterly Results - Jun 2026) <BR>Net Profit: 60 Cr (Quarterly Results - Jun 2026) <BR>Market-cap: INR 4,795 Cr (Small Cap)<BR><BR>Key Metrics:<BR>P/E: 23.00 <BR>Industry P/E: 50 <BR>Dividend Yield: 0.00% <BR>Debt Equity: -0.30 <BR>Return on Equity: 16.74% <BR>Price to Book: 3.91 <BR><BR>Contact Details:<BR>Details: No Company Details Available <BR>Registrar Address: Not available.

View full answer

Who are the peers of the Rolex Rings?

01-Sep-2026

Rolex Rings' peers include L G Balakrishnan, Fiem Industries, Sharda Motor, Jamna Auto Inds., Subros, Steel Str. Wheel, NRB Bearings, Uniparts India, Sandhar Tech, and Wheels India. In terms of returns, Uniparts India leads with 126.09% over one year, while Rolex Rings has a return of 32.65%.

Peers: The peers of Rolex Rings are L G Balakrishnan, Fiem Industries, Sharda Motor, Jamna Auto Inds., Subros, Steel Str. Wheel, NRB Bearings, Uniparts India, Sandhar Tech, and Wheels India.<BR><BR>Quality Snapshot: Excellent management risk is observed at Sharda Motor and Jamna Auto Inds., while Good management risk is found at L G Balakrishnan, Rolex Rings, Steel Str. Wheel, NRB Bearings, and the rest. Average management risk is noted at Subros and Uniparts India, while Sandhar Tech has Average management risk. Growth is Excellent at Sharda Motor and Jamna Auto Inds., while Below Average growth is seen in L G Balakrishnan, Rolex Rings, Fiem Industries, Sharda Motor, Jamna Auto Inds., Subros, Steel Str. Wheel, NRB Bearings, Uniparts India, and the rest. Average growth is found at Fiem Industries and Sandhar Tech. Capital Structure is Excellent for L G Balakrishnan, Fiem Industries, Sharda Motor, Rolex Rings, Jamna Auto Inds., Subros, NRB Bearings, and Uniparts India, while Average capital structure is observed at Steel Str. Wheel and Sandhar Tech.<BR><BR>Return Snapshot: Uniparts India has the highest 1-year return at 126.09%, while Subros has the lowest at -17.64%. Rolex Rings' 1-year return of 32.65% is higher than Fiem Industries and Subros but lower than Uniparts India and NRB Bearings. Additionally, Subros and Sandhar Tech have negative six-month returns.

View full answer

How big is Rolex Rings?

01-Sep-2026

As of 31st August, Rolex Rings Ltd has a market capitalization of 4,795.00 Cr, with recent net sales of 1,156.25 Cr and a net profit of 152.08 Cr.

As of 31st August, Rolex Rings Ltd has a market capitalization of 4,795.00 Cr, categorizing it as a Small Cap company.<BR><BR>In the latest four quarters, Rolex Rings reported Net Sales of 1,156.25 Cr and a Net Profit of 152.08 Cr.<BR><BR>The latest annual reporting period for the balance sheet is March 2025, with Shareholder's Funds amounting to 1,072.11 Cr and Total Assets of 1,282.21 Cr.

View full answer

Are Rolex Rings Ltd latest results good or bad?

06-Aug-2026

Rolex Rings Ltd's latest Q1 FY27 results are generally positive, with a record net profit of ₹60.14 crore and improved operating margins, but modest revenue growth of 4.38% raises concerns about sales momentum. While investors reacted favorably, the company's ability to sustain growth in a recovering automotive sector remains a concern.

Rolex Rings Ltd's latest results for Q1 FY27 show a mixed picture, but overall, they can be considered positive due to significant improvements in profitability metrics. The company reported a net profit of ₹60.14 crore, marking a record high and a substantial turnaround from a marginal loss in the previous quarter. Year-on-year, this represents a growth of 22.34%, which is quite impressive.<BR><BR>However, revenue growth has been modest, with a year-on-year increase of only 4.38% to ₹304.34 crore, and a slight decline of 0.44% compared to the previous quarter. This stagnation in revenue raises concerns about the company's ability to maintain momentum in a recovering automotive sector.<BR><BR>On the positive side, the operating margin improved significantly to 22.58%, the highest in seven quarters, indicating effective cost management. The return on equity stands strong at 20.86%, showcasing good capital efficiency.<BR><BR>While the results reflect strong profitability and margin expansion, the lack of robust revenue growth and recent struggles in maintaining sales momentum may temper the overall positive outlook. Investors reacted positively to the results, as indicated by a 2.58% rise in the stock price, but ongoing concerns about revenue stagnation and underperformance relative to sector peers remain.

View full answer

Should I buy, sell or hold Rolex Rings Ltd?

06-Aug-2026

When is the next results date for Rolex Rings Ltd?

14-May-2026

The next results date for Rolex Rings Ltd is 16 May 2026.

The next results date for Rolex Rings Ltd is scheduled for 16 May 2026.

View full answer

Is Rolex Rings overvalued or undervalued?

26-Nov-2025

As of November 25, 2025, Rolex Rings is fairly valued with a PE ratio of 15.59 and an EV to EBITDA ratio of 11.11, but its recent poor stock performance and lower valuation compared to peers like Bharat Forge suggest underlying challenges.

As of 25 November 2025, Rolex Rings has moved from a very attractive to a fair valuation grade. The company is currently fairly valued based on its financial metrics. The PE ratio stands at 15.59, while the EV to EBITDA ratio is 11.11, and the ROCE is a robust 23.62%. <BR><BR>In comparison to peers, Bharat Forge has a significantly higher PE ratio of 62, indicating a premium valuation, while CIE Automotive, which is rated attractive, has a PE ratio of 19.6. The company's recent stock performance has been underwhelming, with a year-to-date return of -43.45%, contrasting sharply with the Sensex's gain of 8.25% during the same period. This suggests that Rolex Rings may be facing challenges that are not fully reflected in its current valuation.

View full answer

How has been the historical performance of Rolex Rings?

12-Nov-2025

Rolex Rings experienced fluctuating financial performance, with net sales and operating profit declining from March 2024 to March 2025, while profit after tax improved and total assets increased significantly. Despite the challenges, the company showed resilience with a steady rise in cash flow from operating activities.

Answer:<BR>The historical performance of Rolex Rings shows a fluctuating trend in key financial metrics over the years.<BR><BR>Breakdown:<BR>Rolex Rings' net sales peaked at 1,221.76 Cr in March 2024 but declined to 1,154.80 Cr by March 2025. The total operating income followed a similar pattern, reaching 1,221.76 Cr in March 2024 and then decreasing to 1,154.80 Cr in March 2025. The raw material cost was 594.20 Cr in March 2025, down from 631.32 Cr in March 2024. Operating profit (PBDIT) excluding other income was 240.62 Cr in March 2025, a decrease from 261.97 Cr in March 2024. Profit before tax also saw a slight decline, from 209.70 Cr in March 2024 to 207.69 Cr in March 2025. However, profit after tax improved from 156.04 Cr in March 2024 to 174.00 Cr in March 2025. The company's total assets increased from 1,120.90 Cr in March 2024 to 1,282.21 Cr in March 2025, while total liabilities also rose from 1,120.90 Cr to 1,282.21 Cr during the same period. Cash flow from operating activities showed a steady increase, reaching 227.00 Cr in March 2025, compared to 221.00 Cr in March 2024. Overall, while there were declines in sales and operating profit, the company demonstrated resilience with improved profit after tax and a significant increase in total assets.

View full answer

Is Rolex Rings technically bullish or bearish?

24-Sep-2025

As of September 23, 2025, Rolex Rings is in a bearish trend with moderate strength, supported by daily moving averages and weekly/monthly indicators, despite mixed signals from the MACD and a lack of momentum in the RSI.

As of 23 September 2025, the technical trend has changed from mildly bearish to bearish. The current stance is bearish with moderate strength. The daily moving averages indicate a bearish outlook, while the weekly and monthly KST and Bollinger Bands also confirm bearish signals. The MACD shows a mildly bullish trend on the weekly but is mildly bearish on the monthly, indicating mixed signals across time frames. The RSI shows no signals in both weekly and monthly views, suggesting a lack of momentum. Overall, the bearish indicators dominate, reflecting a negative sentiment for Rolex Rings in the current market environment.

View full answer

Who are the top shareholders of the Rolex Rings?

17-Jul-2025

The top shareholders of Rolex Rings include promoter Rupesh Dayashankar Madeka with 10.0%, mutual funds holding 30.9%, and the ICICI Prudential Flexicap Fund as the largest public shareholder at 6.99%. Additionally, Foreign Institutional Investors own 7.27%, while individual investors hold 6.3%.

The top shareholders of Rolex Rings include the promoters, who hold the majority of the shares. The promoter with the highest holding is Rupesh Dayashankar Madeka, owning 10.0% of the company. Additionally, mutual funds hold a significant portion, with 30.9% held by 14 different schemes. Among public shareholders, the largest is the ICICI Prudential Flexicap Fund, which holds 6.99%. Foreign Institutional Investors (FIIs) have a stake of 7.27%, and individual investors collectively own 6.3% of the shares.

View full answer

Has Rolex Rings declared dividend?

06-Jun-2025

No Dividend History Available

iScoreScore
Click here to find our call on this stock
Strong Sell
Sell
Hold
Buy
Strong Buy

Dashboard

1

High Management Efficiency with a high ROE of 20.86%

 
2

Company has a Debt to Equity ratio (avg) of 0.09 times

 
3

Poor long term growth as Net Sales has grown by an annual rate of 8.45% and Operating profit at 8.06% over the last 5 years

 
4

Flat results in Jun 26

5

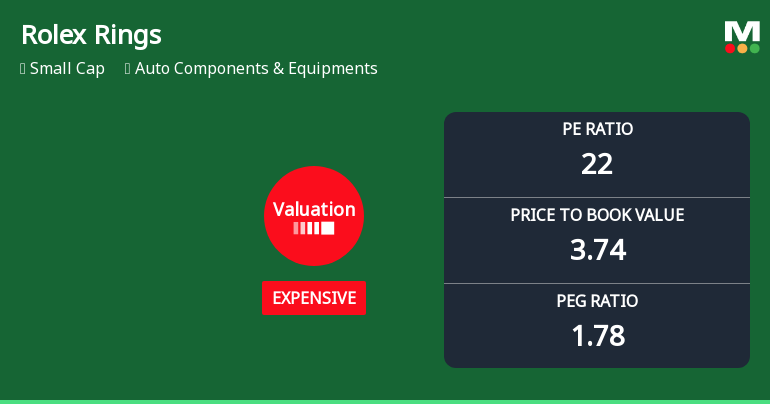
With ROE of 16.7, it has a Expensive valuation with a 3.7 Price to Book Value

6

High Institutional Holdings at 34.15%

7

Market Beating Performance

stock-summaryMojo Parameters

Mojo Parameters

Loading Valuation Snapshot...

Stock DNA

stock-summary
Industry

Auto Components & Equipments

stock-summary
Market cap

INR 4,675 Cr (Small Cap)

stock-summary
P/E

22.00

stock-summary
Industry P/E

49

stock-summary
Dividend Yield

0.00%

stock-summary
Debt Equity

-0.30

stock-summary
Return on Equity

16.74%

stock-summary
Price to Book

3.74

Revenue and Profits:
Net Sales:
304 Cr
(Quarterly Results - Jun 2026)
Net Profit:
60 Cr
stock-summaryTotal Returns
Total Returns (Price + Dividend) stock-summary
Dividend Yield (0%)
TimePeriod
Price Return
Dividend Return
Total Return
3 Months
29.36%
0%
29.36%
6 Months
35.52%
0%
35.52%
1 Year
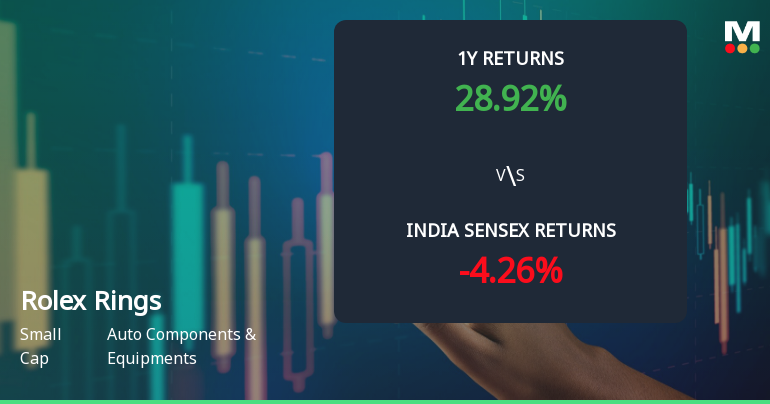
27.36%
0%
27.36%
2 Years
-30.7%
0%
-30.7%
3 Years
-18.96%
0%
-18.96%
4 Years
-4.95%
0%
-4.95%
5 Years
63.81%
0%
63.81%

Rolex Rings for the last several years.

Risk Adjusted Returns v/s stock-summary
Returns Beta
Icon
Beta has not been calculated since enough price history is not available
stock-summaryNews & Corporate Actions

News

Announcements stock-summary

Icon
No announcement available

Corporate Actions stock-summary

stock-summary
BOARD MEETING

No Upcoming Board Meetings

stock-summary
DIVIDEND

No Dividend history available

stock-summary
SPLITS

Rolex Rings Ltd has announced 1:10 stock split, ex-date: 17 Oct 25

stock-summary
BONUS

No Bonus history available

stock-summary
RIGHTS

No Rights history available

stock-summaryKey Factors

Quality key factors stock-summary

Factor
Value
Sales Growth (5y)
8.45%
EBIT Growth (5y)
8.06%
EBIT to Interest (avg)
72.36
Debt to EBITDA (avg)
0.39
Net Debt to Equity (avg)
-0.30
Sales to Capital Employed (avg)
1.22
Tax Ratio
24.55%
Dividend Payout Ratio
0
Pledged Shares
5.13%
Institutional Holding
34.15%
ROCE (avg)
26.88%
ROE (avg)
20.86%

Valuation key factors

Factor
Value
P/E Ratio
22
Industry P/E
49
Price to Book Value
3.74
EV to EBIT
20.86
EV to EBITDA
17.59
EV to Capital Employed
4.94
EV to Sales
3.61
PEG Ratio
1.78
Dividend Yield
NA
ROCE (Latest)
22.82%
ROE (Latest)
16.74%

Technicals key factors

Indicator
Weekly
Monthly
MACD
Bullish
Bullish
RSI
No Signal
Bearish
Bollinger Bands
Mildly Bullish
Mildly Bullish
Moving Averages
Bullish (Daily)
KST
Bullish
Mildly Bullish
Dow Theory
Mildly Bullish
No Trend
OBV
Mildly Bearish
No Trend
stock-summary Technical Indicator Scale: Bearish, Mildly Bearish, Sideways, Mildly Bullish, Bullish  Turned 
stock-summaryShareholding
Shareholding Snapshot : Jun 2026stock-summary
Shareholding Compare (%holding) stock-summary
Majority shareholders

Promoters

Pledged Promoter Holdings

5.1312

Mutual Funds

Held by 12 Schemes (26.95%)

FIIs

Held by 33 FIIs (5.4%)

Promoter with highest holding

Rupesh Dayashankar Madeka (10.0%)

Highest Public shareholder

Icici Prudential Flexicap Fund (6.78%)

Individual Investors Holdings

11.79%

stock-summaryFinancial
[
  {
    "link": "quarterly",
    "btn_text": "All Quarterly Results",
    "header": "Quarterly Results Snapshot (Standalone) - Jun'26 - QoQ",
    "rhs": [
      {
        "prefix": "Net Sales ",
        "suffix": "QoQ Growth in quarter ended Jun 2026 is -0.44% vs 11.22% in Mar 2026",
        "dir": -1
      },
      {
        "prefix": "Standalone Net Profit ",
        "suffix": "QoQ Growth in quarter ended Jun 2026 is 40,193.33% vs -100.31% in Mar 2026",
        "dir": 1
      }
    ],
    "table": {
      "header": [
        "Jun'26",
        "Mar'26",
        "Change(%)"
      ],
      "body": [
        {
          "field": "Net Sales",
          "val1": "304.34",
          "val2": "305.69",
          "chgp": "-0.44%",
          "chgp_class": "negative"
        },
        {
          "field": "Operating Profit (PBDIT) excl Other Income",
          "val1": "68.72",
          "val2": "56.23",
          "chgp": "22.21%",
          "chgp_class": "positive"
        },
        {
          "field": "Interest",
          "val1": "0.23",
          "val2": "0.36",
          "chgp": "-36.11%",
          "chgp_class": "positive"
        },
        {
          "field": "Exceptional Items",
          "val1": "0.00",
          "val2": "-49.20",
          "chgp": "100.00%",
          "chgp_class": "positive"
        },
        {
          "field": "Standalone Net Profit",
          "val1": "60.14",
          "val2": "-0.15",
          "chgp": "40,193.33%",
          "chgp_class": "positive"
        },
        {
          "field": "Operating Profit Margin (Excl OI)",
          "val1": "22.58%",
          "val2": "18.39%",
          "chgp": "4.19%",
          "chgp_class": "positive"
        }
      ]
    }
  },
  {
    "link": "half-yearly",
    "btn_text": "All Half Yearly Results",
    "header": "Half Yearly Results Snapshot (Standalone) - Sep'25",
    "rhs": [
      {
        "prefix": "Net Sales ",
        "suffix": " Growth in half year ended Sep 2025 is -7.87% vs -3.33% in Sep 2024",
        "dir": -1
      },
      {
        "prefix": "Standalone Net Profit ",
        "suffix": " Growth in half year ended Sep 2025 is -5.73% vs 3.95% in Sep 2024",
        "dir": -1
      }
    ],
    "table": {
      "header": [
        "Sep'25",
        "Sep'24",
        "Change(%)"
      ],
      "body": [
        {
          "field": "Net Sales",
          "val1": "562.97",
          "val2": "611.03",
          "chgp": "-7.87%",
          "chgp_class": "negative"
        },
        {
          "field": "Operating Profit (PBDIT) excl Other Income",
          "val1": "116.42",
          "val2": "137.15",
          "chgp": "-15.11%",
          "chgp_class": "negative"
        },
        {
          "field": "Interest",
          "val1": "0.96",
          "val2": "1.09",
          "chgp": "-11.93%",
          "chgp_class": "positive"
        },
        {
          "field": "Exceptional Items",
          "val1": "0.00",
          "val2": "0.00",
          "chgp": "",
          "chgp_class": "neutral"
        },
        {
          "field": "Standalone Net Profit",
          "val1": "93.49",
          "val2": "99.17",
          "chgp": "-5.73%",
          "chgp_class": "negative"
        },
        {
          "field": "Operating Profit Margin (Excl OI)",
          "val1": "20.68%",
          "val2": "22.45%",
          "chgp": "-1.77%",
          "chgp_class": "negative"
        }
      ]
    }
  },
  {
    "link": "nine-monthly",
    "btn_text": "All Nine Monthly Results",
    "header": "Nine Monthly Results Snapshot (Standalone) - Dec'25",
    "rhs": [
      {
        "prefix": "Net Sales ",
        "suffix": "YoY Growth in nine months ended Dec 2025 is -3.80% vs -3.81% in Dec 2024",
        "dir": 1
      },
      {
        "prefix": "Standalone Net Profit ",
        "suffix": "YoY Growth in nine months ended Dec 2025 is 18.33% vs -9.86% in Dec 2024",
        "dir": 1
      }
    ],
    "table": {
      "header": [
        "Dec'25",
        "Dec'24",
        "Change(%)"
      ],
      "body": [
        {
          "field": "Net Sales",
          "val1": "837.81",
          "val2": "870.91",
          "chgp": "-3.80%",
          "chgp_class": "negative"
        },
        {
          "field": "Operating Profit (PBDIT) excl Other Income",
          "val1": "174.03",
          "val2": "188.41",
          "chgp": "-7.63%",
          "chgp_class": "negative"
        },
        {
          "field": "Interest",
          "val1": "1.09",
          "val2": "1.25",
          "chgp": "-12.80%",
          "chgp_class": "positive"
        },
        {
          "field": "Exceptional Items",
          "val1": "-2.45",
          "val2": "-18.60",
          "chgp": "86.83%",
          "chgp_class": "positive"
        },
        {
          "field": "Standalone Net Profit",
          "val1": "141.24",
          "val2": "119.36",
          "chgp": "18.33%",
          "chgp_class": "positive"
        },
        {
          "field": "Operating Profit Margin (Excl OI)",
          "val1": "20.77%",
          "val2": "21.63%",
          "chgp": "-0.86%",
          "chgp_class": "negative"
        }
      ]
    }
  },
  {
    "link": "annual",
    "btn_text": "All Annual Results",
    "header": "Annual Results Snapshot (Standalone) - Mar'26",
    "rhs": [
      {
        "prefix": "Net Sales ",
        "suffix": "YoY Growth in year ended Mar 2026 is -0.98% vs -5.48% in Mar 2025",
        "dir": 1
      },
      {
        "prefix": "Standalone Net Profit ",
        "suffix": "YoY Growth in year ended Mar 2026 is -18.91% vs 11.51% in Mar 2025",
        "dir": -1
      }
    ],
    "table": {
      "header": [
        "Mar'26",
        "Mar'25",
        "Change(%)"
      ],
      "body": [
        {
          "field": "Net Sales",
          "val1": "1,143.50",
          "val2": "1,154.80",
          "chgp": "-0.98%",
          "chgp_class": "negative"
        },
        {
          "field": "Operating Profit (PBDIT) excl Other Income",
          "val1": "230.25",
          "val2": "240.62",
          "chgp": "-4.31%",
          "chgp_class": "negative"
        },
        {
          "field": "Interest",
          "val1": "1.44",
          "val2": "2.38",
          "chgp": "-39.50%",
          "chgp_class": "positive"
        },
        {
          "field": "Exceptional Items",
          "val1": "-51.64",
          "val2": "-18.60",
          "chgp": "-177.63%",
          "chgp_class": "negative"
        },
        {
          "field": "Standalone Net Profit",
          "val1": "141.10",
          "val2": "174.00",
          "chgp": "-18.91%",
          "chgp_class": "negative"
        },
        {
          "field": "Operating Profit Margin (Excl OI)",
          "val1": "20.14%",
          "val2": "20.84%",
          "chgp": "-0.70%",
          "chgp_class": "negative"
        }
      ]
    }
  }
]

Quarterly Results Snapshot (Standalone) - Jun'26 - QoQstock-summary

Jun'26
Mar'26
Change(%)
Net Sales
304.34
305.69
-0.44%
Operating Profit (PBDIT) excl Other Income
68.72
56.23
22.21%
Interest
0.23
0.36
-36.11%
Exceptional Items
0.00
-49.20
100.00%
Standalone Net Profit
60.14
-0.15
40,193.33%
Operating Profit Margin (Excl OI)
22.58%
18.39%
4.19%
Values in Rs Cr.
Direction Arrows
Net Sales

QoQ Growth in quarter ended Jun 2026 is -0.44% vs 11.22% in Mar 2026

Direction Arrows
Standalone Net Profit

QoQ Growth in quarter ended Jun 2026 is 40,193.33% vs -100.31% in Mar 2026

Half Yearly Results Snapshot (Standalone) - Sep'25stock-summary

Sep'25
Sep'24
Change(%)
Net Sales
562.97
611.03
-7.87%
Operating Profit (PBDIT) excl Other Income
116.42
137.15
-15.11%
Interest
0.96
1.09
-11.93%
Exceptional Items
0.00
0.00
Standalone Net Profit
93.49
99.17
-5.73%
Operating Profit Margin (Excl OI)
20.68%
22.45%
-1.77%
Values in Rs Cr.
Direction Arrows
Net Sales

Growth in half year ended Sep 2025 is -7.87% vs -3.33% in Sep 2024

Direction Arrows
Standalone Net Profit

Growth in half year ended Sep 2025 is -5.73% vs 3.95% in Sep 2024

Nine Monthly Results Snapshot (Standalone) - Dec'25stock-summary

Dec'25
Dec'24
Change(%)
Net Sales
837.81
870.91
-3.80%
Operating Profit (PBDIT) excl Other Income
174.03
188.41
-7.63%
Interest
1.09
1.25
-12.80%
Exceptional Items
-2.45
-18.60
86.83%
Standalone Net Profit
141.24
119.36
18.33%
Operating Profit Margin (Excl OI)
20.77%
21.63%
-0.86%
Values in Rs Cr.
Direction Arrows
Net Sales

YoY Growth in nine months ended Dec 2025 is -3.80% vs -3.81% in Dec 2024

Direction Arrows
Standalone Net Profit

YoY Growth in nine months ended Dec 2025 is 18.33% vs -9.86% in Dec 2024

Annual Results Snapshot (Standalone) - Mar'26stock-summary

Mar'26
Mar'25
Change(%)
Net Sales
1,143.50
1,154.80
-0.98%
Operating Profit (PBDIT) excl Other Income
230.25
240.62
-4.31%
Interest
1.44
2.38
-39.50%
Exceptional Items
-51.64
-18.60
-177.63%
Standalone Net Profit
141.10
174.00
-18.91%
Operating Profit Margin (Excl OI)
20.14%
20.84%
-0.70%
Values in Rs Cr.
Direction Arrows
Net Sales

YoY Growth in year ended Mar 2026 is -0.98% vs -5.48% in Mar 2025

Direction Arrows
Standalone Net Profit

YoY Growth in year ended Mar 2026 is -18.91% vs 11.51% in Mar 2025

stock-summaryCompany CV
About Rolex Rings Ltd stock-summary
stock-summary
Rolex Rings Ltd
Small Cap
Auto Components & Equipments
Rolex Rings Limited started the business under partnership firm by two of its Promoters, Rupesh Dayashankar Madeka and Manesh Dayashankar Madeka in 1977-78. The partnership deed was executed at Rajkot on April 26, 1988 and Jiten Dayashankar Madeka was admitted as partner in Rolex Industries.
Company Coordinates stock-summary
Icon
No Company Details Available