
Compare AB Cotspin with Similar Stocks
Dashboard
Poor Management Efficiency with a low ROCE of 9.56%
- The company has been able to generate a Return on Capital Employed (avg) of 9.56% signifying low profitability per unit of total capital (equity and debt)
Low ability to service debt as the company has a high Debt to EBITDA ratio of 3.61 times
Flat results in Dec 25
With ROCE of 9.6, it has a Very Expensive valuation with a 3.6 Enterprise value to Capital Employed
Despite the size of the company, domestic mutual funds hold only 0% of the company
Stock DNA
Garments & Apparels
INR 882 Cr (Micro Cap)
68.00
21
0.00%
0.92
9.47%
6.02
Total Returns (Price + Dividend) 
AB Cotspin for the last several years.
Risk Adjusted Returns v/s
Returns Beta

News

AB Cotspin India Ltd Faces Mildly Bearish Momentum Amid Technical Downgrade
AB Cotspin India Ltd, a player in the Garments & Apparels sector, has recently experienced a shift in its technical momentum, moving from a sideways trend to a mildly bearish stance. This change is underscored by a combination of technical indicators including MACD, RSI, Bollinger Bands, and moving averages, signalling caution for investors amid a subdued price performance relative to the broader market.
Read full news article
AB Cotspin India Ltd is Rated Sell
AB Cotspin India Ltd is rated 'Sell' by MarketsMOJO, with this rating last updated on 16 February 2026. However, the analysis and financial metrics discussed here reflect the stock's current position as of 28 February 2026, providing investors with an up-to-date view of the company’s fundamentals, valuation, financial trend, and technical outlook.
Read full news article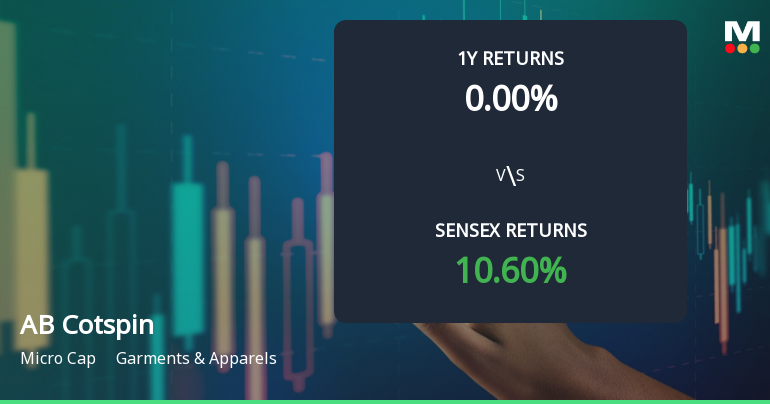
AB Cotspin India Ltd Technical Momentum Shifts Amid Sideways Trend
AB Cotspin India Ltd, a key player in the Garments & Apparels sector, has experienced a notable shift in its technical momentum, moving from a mildly bullish stance to a sideways trend. This change is reflected in various technical indicators including MACD, RSI, and moving averages, signalling a period of consolidation after recent price fluctuations.
Read full news article Announcements
Corporate Actions

No Upcoming Board Meetings

No Dividend history available

No Splits history available

No Bonus history available

No Rights history available
Quality key factors
Valuation key factors
Technicals key factors
 Technical Indicator Scale: Bearish, Mildly Bearish, Sideways, Mildly Bullish, Bullish Turned
 Shareholding Snapshot : Dec 2025
Shareholding Compare (%holding)
Promoters
None
Held by 0 Schemes
Held by 2 FIIs (0.11%)
Deepak Garg (23.25%)
Lotus Hometextiles Limited (6.5%)
37.47%
Quarterly Results Snapshot (Consolidated) - Dec'25 - QoQ

QoQ Growth in quarter ended Dec 2025 is 52.21% vs -23.92% in Sep 2025
QoQ Growth in quarter ended Dec 2025 is -9.67% vs -13.40% in Sep 2025
Half Yearly Results Snapshot (Consolidated) - Sep'25

Growth in half year ended Sep 2025 is -23.68% vs 38.60% in Sep 2024
Growth in half year ended Sep 2025 is 93.55% vs 103.54% in Sep 2024
Nine Monthly Results Snapshot (Consolidated) - Dec'25
YoY Growth in nine months ended Dec 2025 is -8.66% vs 13.21% in Dec 2024
YoY Growth in nine months ended Dec 2025 is 36.67% vs 54.29% in Dec 2024
Annual Results Snapshot (Consolidated) - Mar'25
YoY Growth in year ended Mar 2025 is 16.58% vs 51.25% in Mar 2024
YoY Growth in year ended Mar 2025 is 52.39% vs 247.15% in Mar 2024
About AB Cotspin India Ltd

Company Coordinates


