
Dashboard
Poor Management Efficiency with a low ROE of 3.17%
- The company has been able to generate a Return on Equity (avg) of 3.17% signifying low profitability per unit of shareholders funds
Company has a low Debt to Equity ratio (avg) at 0 times
Healthy long term growth as Operating profit has grown by an annual rate 91.47%
Positive results in Sep 25
With ROE of 4.1, it has a Fair valuation with a 2.7 Price to Book Value
53.66% of Promoter Shares are Pledged
With its market cap of Rs 12,297 cr, it is the second biggest company in the sector (behind LG Electronics)and constitutes 7.97% of the entire sector
Stock DNA
Electronics & Appliances
INR 12,197 Cr (Small Cap)
66.00
46
0.00%
-0.05
4.10%
2.72
Total Returns (Price + Dividend) 
Eureka Forbes for the last several years.
Risk Adjusted Returns v/s
Returns Beta

News
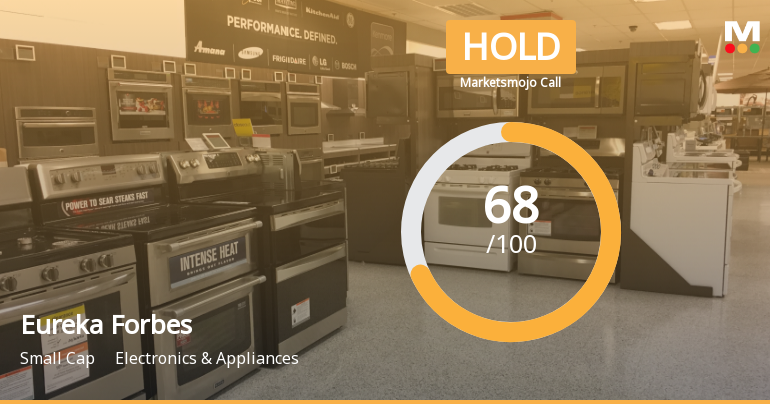
Eureka Forbes Ltd is Rated Hold by MarketsMOJO
Eureka Forbes Ltd is rated 'Hold' by MarketsMOJO, with this rating last updated on 24 November 2025. However, the analysis and financial metrics discussed here reflect the stock's current position as of 27 December 2025, providing investors with an up-to-date view of the company's performance and prospects.
Read More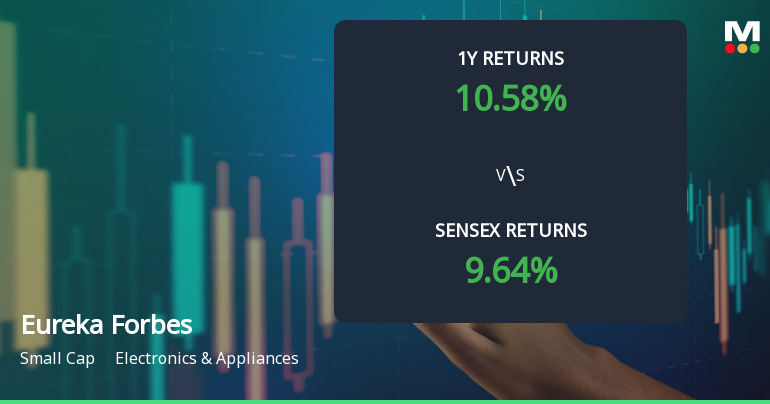
Eureka Forbes Technical Momentum Shifts Amid Mixed Market Signals
Eureka Forbes, a key player in the Electronics & Appliances sector, has experienced a notable shift in its technical momentum, reflecting a complex interplay of bullish and bearish signals across various timeframes. Recent evaluation adjustments highlight a transition in price momentum and technical indicators, offering investors a nuanced perspective on the stock's near-term trajectory.
Read More
Eureka Forbes Technical Momentum Shifts Amid Mixed Indicator Signals
Eureka Forbes, a key player in the Electronics & Appliances sector, has experienced a nuanced shift in its technical momentum, reflecting a complex interplay of indicator signals. Recent market data reveals a transition from a bullish to a mildly bullish trend, with mixed signals from MACD, RSI, moving averages, and other technical parameters shaping investor sentiment.
Read More Announcements
Corporate Actions

No Upcoming Board Meetings

No Dividend history available

No Splits history available

No Bonus history available

No Rights history available
Quality key factors
Valuation key factors
Technicals key factors
 Technical Indicator Scale: Bearish, Mildly Bearish, Sideways, Mildly Bullish, Bullish Turned
 Shareholding Snapshot : Sep 2025
Shareholding Compare (%holding)
Promoters
53.6592
Held by 13 Schemes (4.49%)
Held by 136 FIIs (13.72%)
Lunolux Limited (62.56%)
Hill Fort India Fund Lp (1.87%)
11.87%
Quarterly Results Snapshot (Consolidated) - Sep'25 - QoQ

QoQ Growth in quarter ended Sep 2025 is 27.01% vs -0.78% in Jun 2025
QoQ Growth in quarter ended Sep 2025 is 62.62% vs -21.86% in Jun 2025
Half Yearly Results Snapshot (Consolidated) - Sep'25
Growth in half year ended Sep 2025 is 12.51% vs 11.88% in Sep 2024

Growth in half year ended Sep 2025 is 27.20% vs 55.73% in Sep 2024
Nine Monthly Results Snapshot (Consolidated) - Dec'24
YoY Growth in nine months ended Dec 2024 is 11.53% vs 3.79% in Dec 2023
YoY Growth in nine months ended Dec 2024 is 54.76% vs 1,145.81% in Dec 2023
Annual Results Snapshot (Consolidated) - Mar'25
YoY Growth in year ended Mar 2025 is 11.31% vs 5.02% in Mar 2024
YoY Growth in year ended Mar 2025 is 71.89% vs 260.09% in Mar 2024
About Eureka Forbes Ltd

Company Coordinates


