
Compare Fidel Softech with Similar Stocks
Dashboard
High Management Efficiency with a high ROE of 25.19%
Strong ability to service debt as the company has a low Debt to EBITDA ratio of 2.87 times
Healthy long term growth as Net Sales has grown by an annual rate of 86.00%
The company has declared Positive results for the last 3 consecutive quarters
With ROCE of 24.2, it has a Very Attractive valuation with a 3.3 Enterprise value to Capital Employed
Majority shareholders : Promoters
Stock DNA
Computers - Software & Consulting
INR 202 Cr (Micro Cap)
15.00
21
1.47%
0.16
25.19%
3.67
Total Returns (Price + Dividend) 
Latest dividend: 2.2 per share ex-dividend date: Jul-17-2026
Risk Adjusted Returns v/s
Returns Beta

News
Are Fidel Softech Ltd latest results good or bad?
Fidel Softech Ltd's latest financial results for Q1 FY27 present a mixed picture, highlighting both significant revenue growth and concerning profitability metrics. The company reported net sales of ₹37.93 crores, reflecting a year-on-year growth of 127.94% and a sequential increase of 1.77%. This marks the highest quarterly sales figure in the company's history, indicating strong client acquisition and operational scaling capabilities. However, the net profit for the quarter was ₹3.08 crores, which represents a decline of 24.88% compared to the previous quarter and a decrease of 15.15% year-on-year. This decline in profitability raises questions about the sustainability of the company's growth, particularly as the operating margin fell to 11.68%, down from 12.32% in the previous quarter and significantly lower than the 25.78% achieved in the same quarter last year. The substantial margin compression sugge...
Read full news article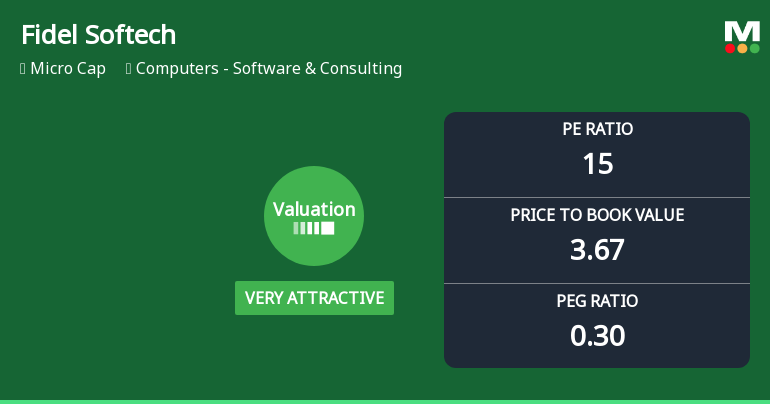
Fidel Softech Ltd Valuation Shifts Signal Renewed Price Attractiveness
Fidel Softech Ltd, a micro-cap player in the Computers - Software & Consulting sector, has seen a significant improvement in its valuation parameters, shifting from attractive to very attractive. This change comes amid a broader sector volatility and a notable downgrade in the company’s market sentiment, reflected in an 8.93% drop in its share price on 31 Jul 2026. Investors are now re-evaluating Fidel Softech’s price-to-earnings and price-to-book ratios in comparison to its peers and historical averages, signalling a potential buying opportunity.
Read full news article
Fidel Softech Q1 FY27: Margin Compression Overshadows Revenue Growth
Fidel Softech Limited, a micro-cap software consulting firm, reported a consolidated net profit of ₹3.08 crores for Q1 FY27, marking a sharp decline of 24.88% quarter-on-quarter despite revenue reaching an all-time high of ₹37.93 crores. The stock plunged 8.93% following the results announcement, reflecting investor concerns over deteriorating profitability metrics even as the company continues its aggressive revenue expansion trajectory.
Read full news article Announcements
Corporate Actions

No Upcoming Board Meetings

Fidel Softech Ltd has declared 22% dividend, ex-date: 17 Jul 26

No Splits history available

No Bonus history available

No Rights history available
Quality key factors
Valuation key factors
Technicals key factors
 Technical Indicator Scale: Bearish, Mildly Bearish, Sideways, Mildly Bullish, Bullish Turned
 Shareholding Snapshot : Jun 2026
Shareholding Compare (%holding)
Promoters
None
Held by 0 Schemes
Held by 1 FIIs (0.01%)
Sunil Sudhakar Kulkarni (55.55%)
Vicco Products Bombay Pvt Ltd (2.73%)
18.92%
Quarterly Results Snapshot (Consolidated) - Jun'26 - QoQ

QoQ Growth in quarter ended Jun 2026 is 1.77% vs 47.31% in Mar 2026
QoQ Growth in quarter ended Jun 2026 is -24.88% vs 24.24% in Mar 2026
Half Yearly Results Snapshot (Consolidated) - Mar'26

Growth in half year ended Mar 2026 is 57.25% vs 51.41% in Sep 2025
Growth in half year ended Mar 2026 is 19.19% vs 43.08% in Sep 2025
Nine Monthly Results Snapshot (Standalone) - Dec'25
YoY Growth in nine months ended Dec 2025 is -1.78% vs 39.85% in Dec 2024
YoY Growth in nine months ended Dec 2025 is 22.97% vs 37.50% in Dec 2024
Annual Results Snapshot (Standalone) - Mar'26
YoY Growth in year ended Mar 2026 is -10.62% vs 36.72% in Mar 2025
YoY Growth in year ended Mar 2026 is 0.43% vs 52.81% in Mar 2025
About Fidel Softech Ltd

Company Coordinates


