
 Price Point
Compare Piramal Pharma with Similar Stocks
ScoreDashboard
Weak Long Term Fundamental Strength with a -9.27% CAGR growth in Operating Profits over the last 5 years
- Low ability to service debt as the company has a high Debt to EBITDA ratio of 6.16 times
- The company has been able to generate a Return on Equity (avg) of 0.58% signifying low profitability per unit of shareholders funds
Negative results in Jun 26
With ROCE of 0.7, it has a Expensive valuation with a 2.4 Enterprise value to Capital Employed
Mojo ParametersStock DNA

Pharmaceuticals & Biotechnology

INR 26,319 Cr (Small Cap)

NA (Loss Making)
37

0.00%

0.53

-1.59%

3.21
Total ReturnsTotal Returns (Price + Dividend) 
Latest dividend: 0.1 per share ex-dividend date: Jul-16-2025
Risk Adjusted Returns v/s
Returns Beta
 News & Corporate Actions
News
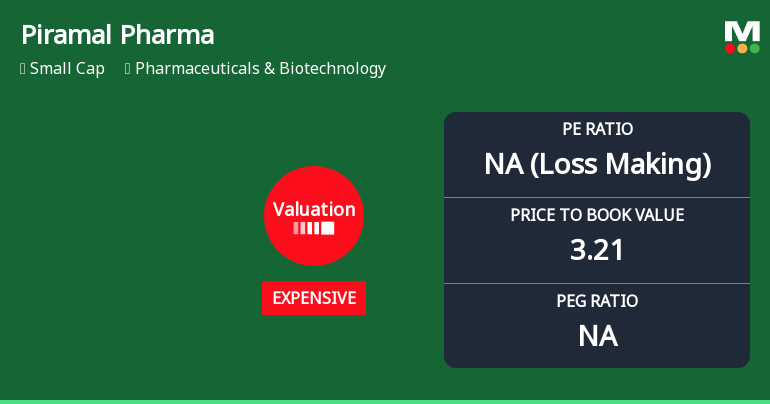
Piramal Pharma Ltd Valuation Shifts Signal Price Attractiveness Concerns
Piramal Pharma Ltd has experienced a notable shift in its valuation parameters, moving from a fair to an expensive rating, prompting a downgrade in its Mojo Grade from Hold to Sell. Despite recent positive price momentum, the company’s elevated price-to-earnings and price-to-book ratios relative to historical and peer averages raise questions about its current price attractiveness for investors.
Read full news article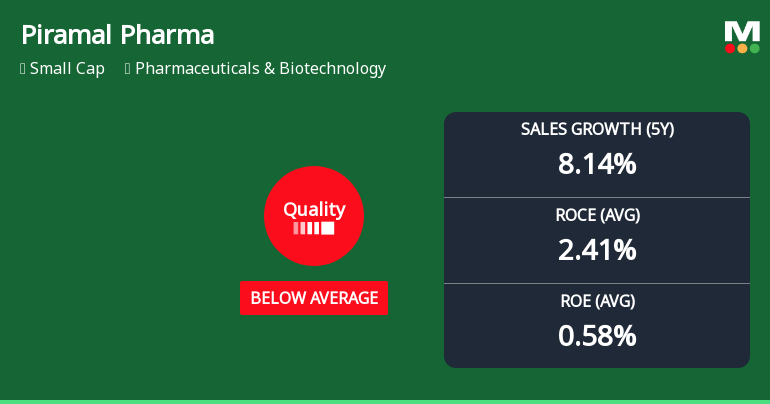
Piramal Pharma Ltd Quality Grade Downgrade Highlights Fundamental Challenges
Piramal Pharma Ltd has recently experienced a downgrade in its quality grade from 'Average' to 'Below Average' as of 16 July 2026, reflecting a notable deterioration in key business fundamentals. This shift accompanies a downgrade in the Mojo Grade from Hold to Sell, signalling growing concerns over the company’s operational efficiency, profitability, and capital structure amid a challenging pharmaceutical sector landscape.
Read full news articleAre Piramal Pharma Ltd latest results good or bad?
Piramal Pharma Ltd's latest financial results for Q1 FY27 present a mixed operational picture. The company reported consolidated net sales of ₹2,269.92 crores, reflecting a year-on-year growth of 17.39%. This increase was driven by improved demand in its Contract Development and Manufacturing Organisation (CDMO) and Consumer Healthcare segments. However, there was a significant sequential decline of 17.51% compared to the previous quarter, indicating volatility in pharmaceutical order flows. Despite the revenue growth, Piramal Pharma faced challenges with profitability, as evidenced by a consolidated net loss of ₹69.39 crores, which widened substantially compared to the previous quarter. The operating margin, while showing a year-on-year improvement to 8.60%, was considerably lower than the 16.74% margin achieved in the previous quarter. This highlights ongoing operational inefficiencies and high financial...
Read full news article Announcements
Corporate Actions

No Upcoming Board Meetings

Piramal Pharma Ltd has declared 1% dividend, ex-date: 16 Jul 25

No Splits history available

No Bonus history available

Piramal Pharma Ltd has announced 5:46 rights issue, ex-date: 02 Aug 23
Key FactorsQuality key factors
Valuation key factors
Technicals key factors
 Technical Indicator Scale: Bearish, Mildly Bearish, Sideways, Mildly Bullish, Bullish Turned Shareholding
Shareholding Snapshot : Jun 2026
Shareholding Compare (%holding)
Non Institution
None
Held by 25 Schemes (13.18%)
Held by 171 FIIs (12.52%)
The Sri Krishna Trust (through Its Trustee Mr. Ajay G Piramal And Dr. (mrs.) Swati A. Piramal) (26.51%)
Ca Alchemy Investments (17.93%)
14.54%
FinancialQuarterly Results Snapshot (Consolidated) - Jun'26 - QoQ
 Compare with Peers
QoQ Growth in quarter ended Jun 2026 is -17.51% vs 28.60% in Mar 2026
QoQ Growth in quarter ended Jun 2026 is -685.84% vs 93.52% in Mar 2026

Half Yearly Results Snapshot (Consolidated) - Sep'25
Growth in half year ended Sep 2025 is -5.14% vs 14.55% in Sep 2024
Growth in half year ended Sep 2025 is -173.91% vs 29.40% in Sep 2024
Nine Monthly Results Snapshot (Consolidated) - Dec'25
YoY Growth in nine months ended Dec 2025 is -4.37% vs 13.85% in Dec 2024
YoY Growth in nine months ended Dec 2025 is -408.43% vs 25.26% in Dec 2024
Annual Results Snapshot (Consolidated) - Mar'26
YoY Growth in year ended Mar 2026 is -3.08% vs 11.99% in Mar 2025
YoY Growth in year ended Mar 2026 is -457.66% vs 411.39% in Mar 2025
 Company CV
About Piramal Pharma Ltd

Company Coordinates








