
Dashboard
With ROE of 23.6, it has a Very Expensive valuation with a 13 Price to Book Value
- The stock is trading at a premium compared to its peers' average historical valuations
- Over the past year, while the stock has generated a return of -27.44%, its profits have risen by 15.8% ; the PEG ratio of the company is 3.6
Underperformed the market in the last 1 year
Stock DNA
Capital Markets
INR 18,969 Cr (Small Cap)
55.00
23
0.00%
0.03
23.63%
12.97
Total Returns (Price + Dividend) 
Latest dividend: 5.7 per share ex-dividend date: Aug-23-2024
Risk Adjusted Returns v/s
Returns Beta

News

KFin Technologies Ltd is Rated Sell by MarketsMOJO
KFin Technologies Ltd is rated 'Sell' by MarketsMOJO, with this rating last updated on 01 Sep 2025. However, the analysis and financial metrics discussed here reflect the stock's current position as of 29 December 2025, providing investors with an up-to-date view of the company's performance and outlook.
Read More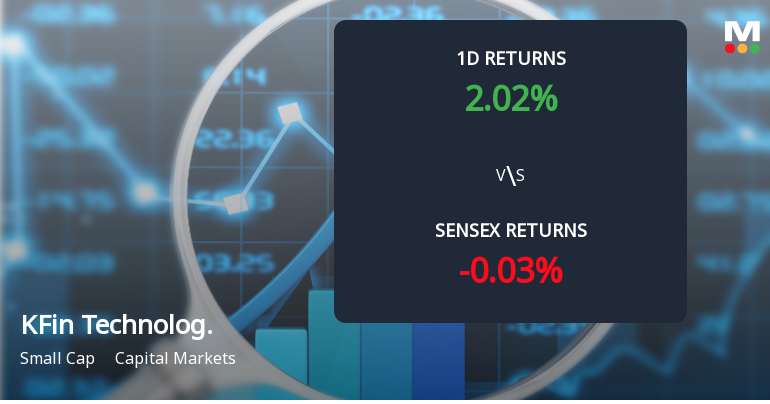
KFin Technologies Sees Notable Surge in Derivatives Open Interest Amid Market Momentum
KFin Technologies Ltd has registered a significant rise in open interest within its derivatives segment, signalling heightened market activity and evolving investor positioning. This development coincides with a series of consecutive gains in the stock price, reflecting a dynamic interplay between volume, price action, and market sentiment in the capital markets sector.
Read More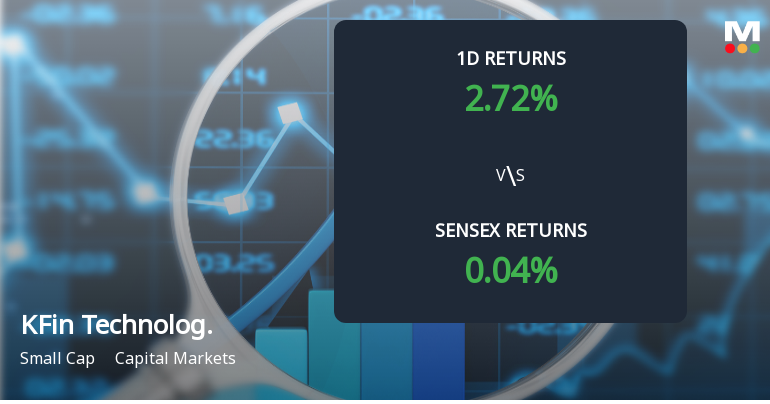
KFin Technologies Sees Significant Open Interest Surge Amidst Market Momentum
KFin Technologies Ltd has experienced a notable surge in open interest in its derivatives segment, coinciding with a period of sustained price gains and increased trading volumes. This development reflects evolving market positioning and heightened investor interest in the capital markets sector, warranting a closer examination of the underlying factors and potential implications for the stock’s near-term trajectory.
Read More Announcements
Corporate Actions

13 Feb 2026

KFin Technologies Ltd has declared 75% dividend, ex-date: 22 Aug 25

No Splits history available

No Bonus history available

No Rights history available
Quality key factors
Valuation key factors
Technicals key factors
 Technical Indicator Scale: Bearish, Mildly Bearish, Sideways, Mildly Bullish, Bullish Turned
 Shareholding Snapshot : Sep 2025
Shareholding Compare (%holding)
Non Institution
None
Held by 26 Schemes (12.44%)
Held by 243 FIIs (25.54%)
General Atlantic Singapore Fund Pte Ltd (21.97%)
Compar Estates And Agencies Private Limited (10.7%)
12.93%
Quarterly Results Snapshot (Consolidated) - Sep'25 - QoQ

QoQ Growth in quarter ended Sep 2025 is 12.83% vs -3.06% in Jun 2025
QoQ Growth in quarter ended Sep 2025 is 20.77% vs -9.16% in Jun 2025
Half Yearly Results Snapshot (Consolidated) - Sep'25

Growth in half year ended Sep 2025 is 12.60% vs 32.67% in Sep 2024
Growth in half year ended Sep 2025 is 8.37% vs 50.25% in Sep 2024
Nine Monthly Results Snapshot (Consolidated) - Dec'24
YoY Growth in nine months ended Dec 2024 is 32.64% vs 13.47% in Dec 2023
YoY Growth in nine months ended Dec 2024 is 44.29% vs 23.68% in Dec 2023
Annual Results Snapshot (Consolidated) - Mar'25
YoY Growth in year ended Mar 2025 is 30.23% vs 16.32% in Mar 2024
YoY Growth in year ended Mar 2025 is 35.19% vs 25.70% in Mar 2024
About KFin Technologies Ltd

Company Coordinates


