
Compare RBM Infracon with Similar Stocks
Dashboard
High Management Efficiency with a high ROE of 16.24%
Company has a Debt to Equity ratio (avg) of 0.02 times
Healthy long term growth as Net Sales has grown by an annual rate of 66.30% and Operating profit at 133.51%
With a growth in Net Sales of 135.25%, the company declared Outstanding results in Jan 70
With ROCE of 12.6, it has a Fair valuation with a 1.4 Enterprise value to Capital Employed
Below par performance in long term as well as near term
Total Returns (Price + Dividend) 
RBM Infracon for the last several years.
Risk Adjusted Returns v/s
Returns Beta

News
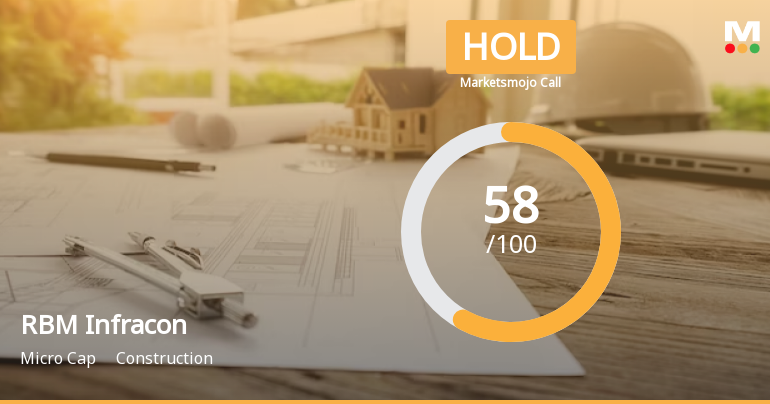
RBM Infracon Ltd is Rated Hold
RBM Infracon Ltd is rated 'Hold' by MarketsMOJO, with this rating last updated on 12 January 2026. However, the analysis and financial metrics discussed here reflect the company’s current position as of 11 June 2026, providing investors with an up-to-date perspective on the stock’s fundamentals, valuation, financial trend, and technical outlook.
Read full news article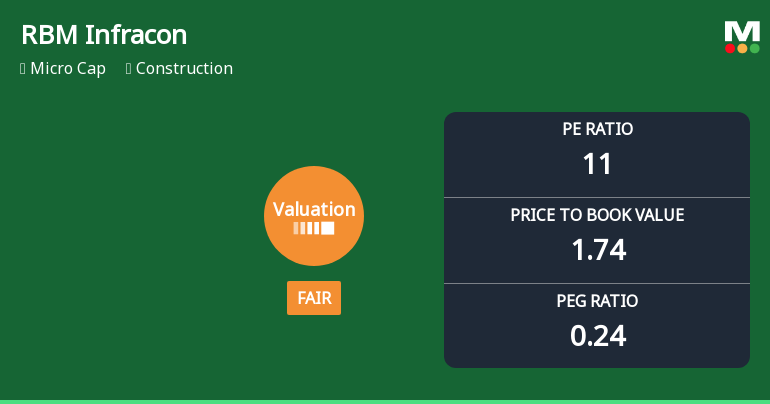
RBM Infracon Ltd Valuation Shifts to Fair Amidst Market Volatility
RBM Infracon Ltd, a micro-cap player in the construction sector, has experienced a notable shift in its valuation parameters, moving from an expensive to a fair valuation grade. This change reflects evolving market perceptions amid a challenging price performance year-to-date and a broader sector context. Investors and analysts are now reassessing the stock’s price attractiveness relative to its historical averages and peer group, with implications for its future outlook.
Read full news article
RBM Infracon Ltd Valuation Shifts: From Risky to Fair Amid Market Volatility
RBM Infracon Ltd, a micro-cap player in the construction sector, has experienced a notable shift in its valuation parameters, moving from a previously risky valuation grade to a fair one. This change reflects evolving market perceptions amid a challenging price environment, with the stock declining 20% in a single day and underperforming broader indices over multiple time frames.
Read full news article Announcements
Corporate Actions

No Upcoming Board Meetings

No Dividend history available

No Splits history available

No Bonus history available

No Rights history available
Quality key factors
Valuation key factors
Technicals key factors
 Technical Indicator Scale: Bearish, Mildly Bearish, Sideways, Mildly Bullish, Bullish Turned
 Shareholding Snapshot : Mar 2026
Shareholding Compare (%holding)
Promoters
None
Held by 0 Schemes
Held by 1 FIIs (0.23%)
Jaybajrang Ramaishish Mani (56.48%)
Manickam Ravichandran (1.88%)
28.58%
Quarterly Results Snapshot (Standalone) - Mar'25 - QoQ

QoQ Growth in quarter ended Mar 2025 is 135.25% vs 0.96% in Dec 2024
QoQ Growth in quarter ended Mar 2025 is 92.09% vs 1.36% in Dec 2024
Half Yearly Results Snapshot (Consolidated) - Mar'26

Growth in half year ended Mar 2026 is -26.68% vs 30.04% in Sep 2025
Growth in half year ended Mar 2026 is -31.80% vs 37.56% in Sep 2025
Nine Monthly Results Snapshot (Standalone) - Mar'25
YoY Growth in nine months ended Mar 2025 is 159.47% vs 132.62% in Dec 2024
YoY Growth in nine months ended Mar 2025 is 139.70% vs 136.47% in Dec 2024
Annual Results Snapshot (Consolidated) - Mar'26
YoY Growth in year ended Mar 2026 is 52.98% vs 148.02% in Mar 2025
YoY Growth in year ended Mar 2026 is 53.65% vs 165.73% in Mar 2025
About RBM Infracon Ltd

Company Coordinates


