
Compare Nirman Agri with Similar Stocks
Stock DNA
Other Agricultural Products
INR 36 Cr (Micro Cap)
1.00
13
0.00%
-0.01
13.81%
0.28
Total Returns (Price + Dividend) 
Latest dividend: 2 per share ex-dividend date: Sep-25-2024
Risk Adjusted Returns v/s
Returns Beta

News

Nirman Agri Genetics Ltd is Rated Sell
Nirman Agri Genetics Ltd is rated 'Sell' by MarketsMOJO, with this rating last updated on 01 June 2026. However, the analysis and financial metrics discussed here reflect the stock’s current position as of 18 June 2026, providing investors with the most recent and relevant data to assess the company’s outlook.
Read full news article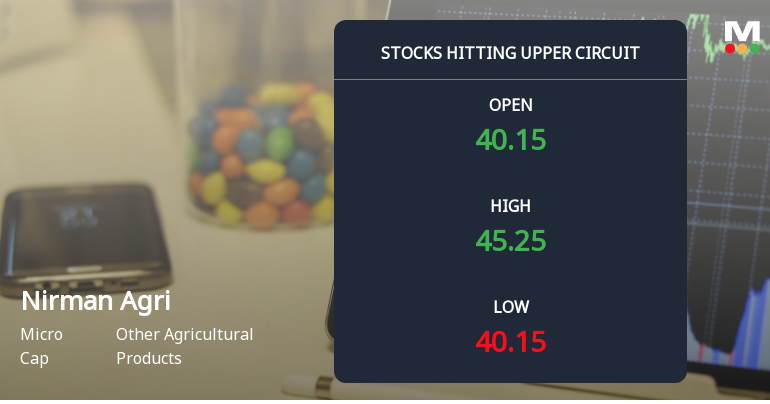
A 9.96% Single-Day Surge Takes Nirman Agri Genetics Ltd to Its Upper Circuit Limit of Rs 45.25
At Rs 45.25, the buying was done — not because demand dried up, but because the exchange wouldn't let the stock go any higher. Nirman Agri Genetics Ltd locked at its upper circuit of 9.96% on 09 Jun 2026, with buyers queuing and no sellers willing to part with shares.
Read full news article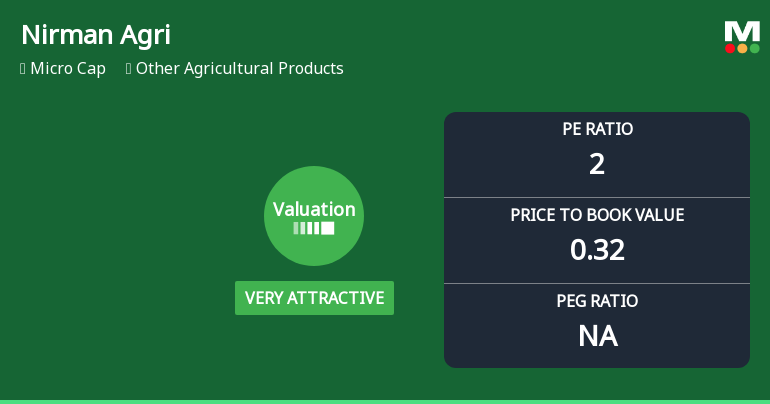
Nirman Agri Genetics Ltd Valuation Shifts Signal Renewed Price Attractiveness
Nirman Agri Genetics Ltd has witnessed a significant transformation in its valuation parameters, shifting from a risky profile to one deemed very attractive. With a current price of ₹48.65 and a micro-cap market status, the company’s price-to-earnings (P/E) and price-to-book value (P/BV) ratios now stand at historically low levels, prompting a reassessment of its price attractiveness relative to peers and past benchmarks.
Read full news article Announcements
Corporate Actions

No Upcoming Board Meetings

Nirman Agri Genetics Ltd has declared 20% dividend, ex-date: 25 Sep 24

No Splits history available

No Bonus history available

Nirman Agri Genetics Ltd has announced 11:32 rights issue, ex-date: 29 Jul 24
Quality key factors
Valuation key factors
Technicals key factors
 Technical Indicator Scale: Bearish, Mildly Bearish, Sideways, Mildly Bullish, Bullish Turned
 Shareholding Snapshot : Mar 2026
Shareholding Compare (%holding)
Non Institution
None
Held by 0 Schemes
Held by 2 FIIs (0.02%)
Pranav Kailas Bagal (44.33%)
Lukman Munavar Patel (2.13%)
52.27%
Quarterly Results Snapshot (Standalone) - Mar'25 - QoQ

QoQ Growth in quarter ended Mar 2025 is 3.16% vs -1.64% in Dec 2024

QoQ Growth in quarter ended Mar 2025 is 2.82% vs 4.83% in Dec 2024
Half Yearly Results Snapshot (Standalone) - Sep'25
Growth in half year ended Sep 2025 is 17.86% vs 10.33% in Mar 2025
Growth in half year ended Sep 2025 is 6.81% vs 19.21% in Mar 2025
Nine Monthly Results Snapshot (Standalone) - Mar'25
YoY Growth in nine months ended Mar 2025 is 20.58% vs 304.76% in Dec 2024
YoY Growth in nine months ended Mar 2025 is 18.26% vs 157.14% in Dec 2024
Annual Results Snapshot (Standalone) - Mar'25
YoY Growth in year ended Mar 2025 is 273.41% vs 121.39% in Mar 2024
YoY Growth in year ended Mar 2025 is 143.17% vs 159.35% in Mar 2024
About Nirman Agri Genetics Ltd

Company Coordinates


