JNK

  • Market Cap: Micro Cap
  • Industry: Industrial Manufacturing
  • ISIN: INE0OAF01028
  • NSEID: JNKINDIA
  • BSEID: 544167
INR
391.00
3.4 (0.88%)
BSENSE

May 25

BSE+NSE Vol: 1.98 lacs

  • Price Points
  • Score
  • Mojo Parameters
  • Total Return
  • News and Corporate Actions
  • Key factors
  • Shareholding
  • Financials
  • CompanyCV
stock-summaryPrice Point
High/Low

1Day

52 Week

Valuation
Technical
Day's Volume

CASH

1.98 lacs (-20.86%) Volume

Shareholding (Mar 2026)

FII

1.17%

Held by 8 FIIs

DII

12.57%

Held by 14 DIIs

Promoter

67.79%

What does JNK do?

06-Jun-2025

JNK India Ltd is a small-cap industrial manufacturing company, incorporated in 2010 and transitioned to a public entity in 2023, with recent quarterly net sales of ₹191 Cr and net profit of ₹13 Cr. Key financial metrics include a P/E ratio of 64.00 and a market cap of ₹1,931 Cr.

Overview:<BR>JNK India Ltd operates in the industrial manufacturing sector and is classified as a small-cap company.<BR><BR>History:<BR>JNK India Ltd was incorporated in 2010 as "JNK India Private Limited" in Thane, Maharashtra. The company transitioned from a private to a public entity, adopting its current name on May 26, 2023. The most recent quarterly results reported net sales and net profit for March 2025.<BR><BR>Financial Snapshot:<BR>- Net Sales: 191 Cr (Quarterly Results - Mar 2025)<BR>- Net Profit: 13 Cr (Quarterly Results - Mar 2025)<BR>- Market Cap: Rs 1,931 Cr (Small Cap)<BR><BR>Key Metrics:<BR>- P/E: 64.00<BR>- Industry P/E: 38<BR>- Dividend Yield: 0.09%<BR>- Debt Equity: -0.33<BR>- Return on Equity: 5.99%<BR>- Price to Book: 3.81<BR><BR>Contact Details:<BR>Registrar Address: Not available.

View full answer

Has JNK declared dividend?

06-Jun-2025

Yes, JNK India Ltd has declared a dividend of 15% (0.3 per share) with an ex-date of October 21, 2024. However, total returns over the past periods show significant declines in price returns, with minimal impact from dividends.

Yes, JNK India Ltd has declared a dividend.<BR><BR>Dividend Details:<BR>- Percentage announced: 15%<BR>- Amount per share: 0.3<BR>- Ex-date: 21 Oct 24<BR><BR>Dividend Yield: 0.09%.<BR><BR>Total Returns by Period:<BR>In the last 6 months, the price return was -43.31%, with a dividend return of 0%, resulting in a total return of -43.31%.<BR><BR>Over the past year, the price return was -42.77%, with a dividend return of 0.05%, leading to a total return of -42.72%.<BR><BR>For the 2-year period, there was no price return or dividend return, resulting in a total return of 0.0%.<BR><BR>In the 3-year period, both the price return and dividend return were 0%, yielding a total return of 0.0%.<BR><BR>During the 4-year period, there was no change in price or dividends, resulting in a total return of 0.0%.<BR><BR>In the 5-year period, the price return and dividend return remained unchanged, leading to a total return of 0.0%.<BR><BR>Overall, while JNK India Ltd has declared a dividend, the total returns over various periods indicate significant declines in price returns, with minimal impact from dividends.

View full answer

Who are the peers of the JNK?

16-Jul-2025

JNK's peers include Rajoo Engineers, Hind Rectifiers, Disa India, DEE Development, Everest Kanto, Indef Manufactur, Eimco Elecon(I), Aimtron, and Vinyas Innovativ. JNK has excellent management and capital structure but a poor 1-year return of -59.65%, while Hind Rectifiers leads with a 78.82% return.

Peers: The peers of JNK are Rajoo Engineers, Hind Rectifiers, Disa India, DEE Development, Everest Kanto, Indef Manufactur, Eimco Elecon(I), Aimtron, and Vinyas Innovativ.<BR><BR>Quality Snapshot: Excellent management risk is observed at Disa India and JNK, while Average management risk is found at Rajoo Engineers, Hind Rectifiers, DEE Development, Everest Kanto, Indef Manufactur, and Aimtron, and Below Average management risk is noted at Eimco Elecon(I). Growth is Excellent at Rajoo Engineers and Aimtron, Good at Disa India, DEE Development, JNK, and Vinyas Innovativ, while Below Average growth is seen at Hind Rectifiers and Indef Manufactur. Excellent capital structure is present in Disa India, JNK, Everest Kanto, Indef Manufactur, Eimco Elecon(I), and Aimtron, while Below Average capital structure is found at Hind Rectifiers and Vinyas Innovativ.<BR><BR>Return Snapshot: Hind Rectifiers has the highest 1-year return at 78.82%, while JNK has the lowest at -59.65%, indicating a significant negative performance compared to its peers. Additionally, the six-month return is negative for Rajoo Engineers, JNK, Everest Kanto, and Indef Manufactur.

View full answer

Who are the top shareholders of the JNK?

17-Jul-2025

The top shareholders of JNK include Mascot Capital And Marketing Private Limited with 32.56%, mutual funds at 17.83%, foreign institutional investors at 3.06%, and the DSP Small Cap Fund as the largest public shareholder at 5.27%. Individual investors collectively own 10.3% of the company.

The top shareholders of JNK include several key players. The majority shareholders are the promoters, with Mascot Capital And Marketing Private Limited holding the largest share at 32.56%. In terms of institutional investment, mutual funds hold a combined 17.83% through 8 schemes, while foreign institutional investors (FIIs) account for 3.06% through 10 different FIIs. The highest public shareholder is the DSP Small Cap Fund, which holds 5.27%. Additionally, individual investors collectively own 10.3% of the company.

View full answer

How big is JNK?

24-Jul-2025

As of 24th July, JNK India Ltd has a market capitalization of 1,887.00 Cr, with recent net sales of 476.28 Cr and a net profit of 30.21 Cr. The latest balance sheet shows shareholder's funds of 195.36 Cr and total assets of 524.74 Cr.

As of 24th July, JNK India Ltd has a market capitalization of 1,887.00 Cr, categorizing it as a Small Cap company.<BR><BR>In the latest four quarters, JNK India Ltd reported Net Sales of 476.28 Cr and a Net Profit of 30.21 Cr.<BR><BR>The latest annual period for the balance sheet is March 2024, with Shareholder's Funds amounting to 195.36 Cr and Total Assets of 524.74 Cr.

View full answer

How has been the historical performance of JNK?

17-Nov-2025

JNK's historical performance shows increasing net sales and total assets, but declining profitability and negative cash flow in recent years, with profit after tax dropping from INR 62.65 crore in March 2024 to INR 30.20 crore in March 2025. Total expenditure rose significantly, impacting operating profit and cash flow.

Answer:<BR>The historical performance of JNK shows a fluctuating trend in key financial metrics over the past five years.<BR><BR>Breakdown:<BR>JNK's net sales have seen a steady increase from INR 137.72 crore in March 2021 to INR 476.65 crore in March 2025, although there was a slight decline from INR 480.46 crore in March 2024. Total operating income followed a similar trend, reaching INR 476.65 crore in March 2025. The total expenditure, excluding depreciation, rose significantly from INR 112.44 crore in March 2021 to INR 430.14 crore in March 2025. Operating profit (PBDIT) peaked at INR 104.50 crore in March 2024 but dropped to INR 64.88 crore in March 2025. Profit before tax also decreased from INR 88.90 crore in March 2024 to INR 44.06 crore in March 2025, leading to a profit after tax of INR 30.20 crore in March 2025, down from INR 62.65 crore in the previous year. The company's total assets increased from INR 125.12 crore in March 2021 to INR 782.33 crore in March 2025, while total liabilities rose from INR 125.12 crore to INR 782.33 crore in the same period. Cash flow from operating activities turned negative in March 2025 at INR -65.00 crore, contrasting with a positive cash flow of INR 20.00 crore in March 2023. Overall, JNK's financial performance reflects growth in sales and assets but challenges in profitability and cash flow in recent years.

View full answer

Is JNK technically bullish or bearish?

02-Dec-2025

As of December 1, 2025, JNK's technical trend has shifted to bearish, supported by a bearish MACD, negative Bollinger Bands signals, and bearish moving averages, despite mixed momentum indicated by the RSI.

As of 1 December 2025, the technical trend has changed from mildly bearish to bearish. The current technical stance for JNK is bearish with a strong indication of weakness. Key indicators driving this stance include a bearish MACD on the weekly timeframe, bearish signals from Bollinger Bands on both weekly and monthly timeframes, and bearish moving averages on the daily timeframe. Additionally, Dow Theory confirms a bearish outlook on both weekly and monthly levels. The RSI shows a bullish signal on the monthly but lacks a clear signal on the weekly, indicating mixed momentum. Overall, the bearish trend is reinforced by the significant negative returns over the past week and month compared to the Sensex.

View full answer

Is JNK overvalued or undervalued?

05-Dec-2025

As of December 4, 2025, JNK is considered overvalued with a valuation grade of expensive, reflected by a PE ratio of 41.59 and a year-to-date return of -65.68%, significantly underperforming compared to the Sensex's 9.12%.

As of 4 December 2025, the valuation grade for JNK has moved from very expensive to expensive. The company is currently considered overvalued based on its financial metrics. Key ratios include a PE ratio of 41.59, an EV to EBITDA of 24.51, and a Price to Book Value of 2.42. <BR><BR>In comparison to its peers, JNK's valuation appears high, especially when looking at Thermax with a PE of 57.65 and BEML Ltd with a PE of 49.7, both categorized as expensive. Additionally, JNK's recent stock performance has significantly lagged behind the Sensex, with a year-to-date return of -65.68% compared to the Sensex's 9.12%, reinforcing the notion that JNK is overvalued in the current market environment.

View full answer

When is the next results date for JNK India Ltd?

05-Feb-2026

The next results date for JNK India Ltd is 09 February 2026.

The next results date for JNK India Ltd is scheduled for 09 February 2026.

View full answer

Are JNK India Ltd latest results good or bad?

22-May-2026

JNK India Ltd's latest Q4 FY26 results are strong, with a net profit increase of 146.60% and revenue growth of 77.25%, marking the highest revenue in its history. However, concerns about low return on equity (5.86%) and negative operating cash flow indicate potential challenges ahead.

JNK India Ltd's latest results for Q4 FY26 indicate a strong performance overall. The company reported a net profit of ₹32.65 crore, which is a remarkable increase of 146.60% year-on-year. Revenue also saw significant growth, reaching ₹338.44 crore, up 77.25% from the same quarter last year. This quarter marks the highest revenue in the company's recent history, with a sequential growth of 67.02% compared to the previous quarter.<BR><BR>Operating margins improved to 13.64%, the best in eight quarters, and the profit after tax (PAT) margin increased to 9.76%, reflecting enhanced profitability. The operating profit (PBDIT) surged by 211% year-on-year, indicating strong operational momentum.<BR><BR>However, there are some concerns. The company's return on equity (ROE) remains low at 5.86%, suggesting that while the company is growing its revenues and profits, it is not generating adequate returns on shareholder capital. Additionally, the company has faced challenges with cash flow, reporting negative operating cash flow due to substantial working capital absorption.<BR><BR>In summary, while JNK India Ltd's latest results show impressive growth in revenue and profits, the underlying issues related to cash flow and return on equity suggest a more nuanced picture that investors should consider carefully.

View full answer

Should I buy, sell or hold JNK India Ltd?

23-May-2026

Why is JNK India Ltd falling/rising?

25-May-2026

As of 24-May, JNK India Ltd's stock price is currently at 388.00, reflecting a decline of 5.5% after a trend reversal. Despite recent gains and a significant year-to-date increase of 55.89%, today's drop indicates a correction following strong performance.

As of 24-May, JNK India Ltd's stock price is falling, currently at 388.00, which reflects a change of -22.6 or -5.5%. This decline follows a trend reversal after four consecutive days of gains. Today, the stock underperformed its sector by -6.09% and reached an intraday low of Rs 380.1, marking a decrease of 7.43%. Additionally, the stock has exhibited high volatility with an intraday volatility of 5.42%. <BR><BR>Despite these negative movements, it is noteworthy that JNK India Ltd recently hit a new 52-week high of Rs 414.95 earlier today. However, the performance over the past week shows a significant gain of 17.88%, while the stock has risen 12.94% over the past month. Year-to-date, it has increased by 55.89%, contrasting sharply with the Sensex, which has declined by 11.51% during the same period. <BR><BR>The stock is also trading above its moving averages across various time frames, indicating a generally positive trend prior to today's decline. Furthermore, there has been a notable increase in investor participation, with delivery volume rising by 389.36% against the 5-day average. Despite these positive indicators, the immediate price drop suggests a correction after a period of strong performance.

View full answer
iScoreScore
Click here to find our call on this stock
Strong Sell
Sell
Hold
Buy
Strong Buy

Dashboard

1

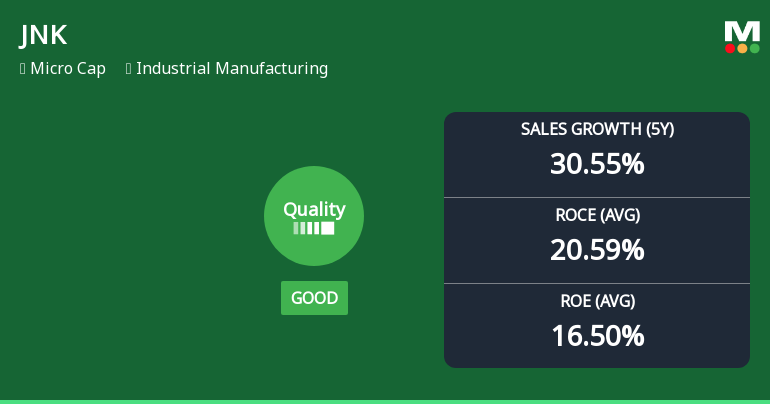
High Management Efficiency with a high ROE of 16.50%

 
2

Company has a Debt to Equity ratio (avg) of 0.06 times

 
3

With a growth in Net Profit of 87.41%, the company declared Outstanding results in Mar 26

stock-summaryMojo Parameters

Mojo Parameters

Loading Valuation Snapshot...

Stock DNA

stock-summary
Industry

Industrial Manufacturing

stock-summary
Market cap

INR 2,188 Cr (Micro Cap)

stock-summary
P/E

33.00

stock-summary
Industry P/E

36

stock-summary
Dividend Yield

0.08%

stock-summary
Debt Equity

-0.31

stock-summary
Return on Equity

5.86%

stock-summary
Price to Book

3.80

Revenue and Profits:
Net Sales:
338 Cr
(Quarterly Results - Mar 2026)
Net Profit:
33 Cr
stock-summaryTotal Returns
Total Returns (Price + Dividend) stock-summary
Dividend Yield (0.08%)
TimePeriod
Price Return
Dividend Return
Total Return
3 Months
64.13%
0%
64.13%
6 Months
55.53%
0%
55.53%
1 Year
9.2%
0.08%
9.28%
2 Years
-41.13%
0.10%
-41.03%
3 Years
0%
0%
0.0%
4 Years
0%
0%
0.0%
5 Years
0%
0%
0.0%

Latest dividend: 0.3 per share ex-dividend date: Sep-18-2025

Risk Adjusted Returns v/s stock-summary
Returns Beta
Icon
Beta has not been calculated since enough price history is not available
stock-summaryNews & Corporate Actions

News

stock-summaryKey Factors

Quality key factors stock-summary

Factor
Value
Sales Growth (5y)
30.55%
EBIT Growth (5y)
-8.64%
EBIT to Interest (avg)
5.77
Debt to EBITDA (avg)
0.90
Net Debt to Equity (avg)
-0.22
Sales to Capital Employed (avg)
1.11
Tax Ratio
23.93%
Dividend Payout Ratio
2.32%
Pledged Shares
0
Institutional Holding
13.74%
ROCE (avg)
20.59%
ROE (avg)
16.50%

Valuation key factors

Factor
Value
P/E Ratio
33
Industry P/E
36
Price to Book Value
3.79
EV to EBIT
24.46
EV to EBITDA
22.11
EV to Capital Employed
4.56
EV to Sales
2.48
PEG Ratio
0.29
Dividend Yield
0.08%
ROCE (Latest)
18.65%
ROE (Latest)
11.44%

Technicals key factors

Indicator
Weekly
Monthly
MACD
Bullish
RSI
No Signal
No Signal
Bollinger Bands
Bullish
Bullish
Moving Averages
Bullish (Daily)
KST
Bullish
Dow Theory
No Trend
Mildly Bullish
OBV
Bullish
Bullish
stock-summary Technical Indicator Scale: Bearish, Mildly Bearish, Sideways, Mildly Bullish, Bullish  Turned 
stock-summaryShareholding
Shareholding Snapshot : Mar 2026stock-summary
Shareholding Compare (%holding) stock-summary
Majority shareholders

Promoters

Pledged Promoter Holdings

None

Mutual Funds

Held by 5 Schemes (12.52%)

FIIs

Held by 8 FIIs (1.17%)

Promoter with highest holding

Mascot Capital And Marketing Private Limited (32.64%)

Highest Public shareholder

Dsp Small Cap Fund (5.45%)

Individual Investors Holdings

16.58%

stock-summaryFinancial
[
  {
    "link": "quarterly",
    "btn_text": "All Quarterly Results",
    "header": "Quarterly Results Snapshot (Consolidated) - Mar'26 - QoQ",
    "rhs": [
      {
        "prefix": "Net Sales ",
        "suffix": "QoQ Growth in quarter ended Mar 2026 is 67.02% vs 13.60% in Dec 2025",
        "dir": 1
      },
      {
        "prefix": "Consolidated Net Profit ",
        "suffix": "QoQ Growth in quarter ended Mar 2026 is 81.59% vs 36.32% in Dec 2025",
        "dir": 1
      }
    ],
    "table": {
      "header": [
        "Mar'26",
        "Dec'25",
        "Change(%)"
      ],
      "body": [
        {
          "field": "Net Sales",
          "val1": "338.44",
          "val2": "202.64",
          "chgp": "67.02%",
          "chgp_class": "positive"
        },
        {
          "field": "Operating Profit (PBDIT) excl Other Income",
          "val1": "46.18",
          "val2": "25.92",
          "chgp": "78.16%",
          "chgp_class": "positive"
        },
        {
          "field": "Interest",
          "val1": "6.66",
          "val2": "4.16",
          "chgp": "60.10%",
          "chgp_class": "negative"
        },
        {
          "field": "Exceptional Items",
          "val1": "0.00",
          "val2": "0.00",
          "chgp": "",
          "chgp_class": "neutral"
        },
        {
          "field": "Consolidate Net Profit",
          "val1": "32.65",
          "val2": "17.98",
          "chgp": "81.59%",
          "chgp_class": "positive"
        },
        {
          "field": "Operating Profit Margin (Excl OI)",
          "val1": "13.64%",
          "val2": "12.79%",
          "chgp": "0.85%",
          "chgp_class": "positive"
        }
      ]
    }
  },
  {
    "link": "half-yearly",
    "btn_text": "All Half Yearly Results",
    "header": "Half Yearly Results Snapshot (Consolidated) - Sep'25",
    "rhs": [
      {
        "prefix": "Net Sales ",
        "suffix": " Growth in half year ended Sep 2025 is 44.58% vs 43.63% in Sep 2024",
        "dir": 1
      },
      {
        "prefix": "Consolidated Net Profit ",
        "suffix": " Growth in half year ended Sep 2025 is 0.21% vs -12.30% in Sep 2024",
        "dir": 1
      }
    ],
    "table": {
      "header": [
        "Sep'25",
        "Sep'24",
        "Change(%)"
      ],
      "body": [
        {
          "field": "Net Sales",
          "val1": "277.48",
          "val2": "191.92",
          "chgp": "44.58%",
          "chgp_class": "positive"
        },
        {
          "field": "Operating Profit (PBDIT) excl Other Income",
          "val1": "19.80",
          "val2": "21.38",
          "chgp": "-7.39%",
          "chgp_class": "negative"
        },
        {
          "field": "Interest",
          "val1": "6.47",
          "val2": "5.75",
          "chgp": "12.52%",
          "chgp_class": "negative"
        },
        {
          "field": "Exceptional Items",
          "val1": "0.00",
          "val2": "0.00",
          "chgp": "",
          "chgp_class": "neutral"
        },
        {
          "field": "Consolidate Net Profit",
          "val1": "14.15",
          "val2": "14.12",
          "chgp": "0.21%",
          "chgp_class": "positive"
        },
        {
          "field": "Operating Profit Margin (Excl OI)",
          "val1": "7.14%",
          "val2": "11.14%",
          "chgp": "-4.00%",
          "chgp_class": "negative"
        }
      ]
    }
  },
  {
    "link": "nine-monthly",
    "btn_text": "All Nine Monthly Results",
    "header": "Nine Monthly Results Snapshot (Consolidated) - Dec'25",
    "rhs": [
      {
        "prefix": "Net Sales ",
        "suffix": "YoY Growth in nine months ended Dec 2025 is 67.99% vs 12.79% in Dec 2024",
        "dir": 1
      },
      {
        "prefix": "Consolidated Net Profit ",
        "suffix": "YoY Growth in nine months ended Dec 2025 is 89.45% vs -63.13% in Dec 2024",
        "dir": 1
      }
    ],
    "table": {
      "header": [
        "Dec'25",
        "Dec'24",
        "Change(%)"
      ],
      "body": [
        {
          "field": "Net Sales",
          "val1": "480.12",
          "val2": "285.80",
          "chgp": "67.99%",
          "chgp_class": "positive"
        },
        {
          "field": "Operating Profit (PBDIT) excl Other Income",
          "val1": "45.72",
          "val2": "28.08",
          "chgp": "62.82%",
          "chgp_class": "positive"
        },
        {
          "field": "Interest",
          "val1": "10.63",
          "val2": "10.99",
          "chgp": "-3.28%",
          "chgp_class": "positive"
        },
        {
          "field": "Exceptional Items",
          "val1": "0.00",
          "val2": "0.00",
          "chgp": "",
          "chgp_class": "neutral"
        },
        {
          "field": "Consolidate Net Profit",
          "val1": "32.13",
          "val2": "16.96",
          "chgp": "89.45%",
          "chgp_class": "positive"
        },
        {
          "field": "Operating Profit Margin (Excl OI)",
          "val1": "9.52%",
          "val2": "9.83%",
          "chgp": "-0.31%",
          "chgp_class": "negative"
        }
      ]
    }
  },
  {
    "link": "annual",
    "btn_text": "All Annual Results",
    "header": "Annual Results Snapshot (Consolidated) - Mar'26",
    "rhs": [
      {
        "prefix": "Net Sales ",
        "suffix": "YoY Growth in year ended Mar 2026 is 71.73% vs -0.79% in Mar 2025",
        "dir": 1
      },
      {
        "prefix": "Consolidated Net Profit ",
        "suffix": "YoY Growth in year ended Mar 2026 is 115.00% vs -51.78% in Mar 2025",
        "dir": 1
      }
    ],
    "table": {
      "header": [
        "Mar'26",
        "Mar'25",
        "Change(%)"
      ],
      "body": [
        {
          "field": "Net Sales",
          "val1": "818.55",
          "val2": "476.65",
          "chgp": "71.73%",
          "chgp_class": "positive"
        },
        {
          "field": "Operating Profit (PBDIT) excl Other Income",
          "val1": "91.90",
          "val2": "42.82",
          "chgp": "114.62%",
          "chgp_class": "positive"
        },
        {
          "field": "Interest",
          "val1": "17.29",
          "val2": "14.50",
          "chgp": "19.24%",
          "chgp_class": "negative"
        },
        {
          "field": "Exceptional Items",
          "val1": "0.00",
          "val2": "0.00",
          "chgp": "",
          "chgp_class": "neutral"
        },
        {
          "field": "Consolidate Net Profit",
          "val1": "64.95",
          "val2": "30.21",
          "chgp": "115.00%",
          "chgp_class": "positive"
        },
        {
          "field": "Operating Profit Margin (Excl OI)",
          "val1": "11.23%",
          "val2": "8.98%",
          "chgp": "2.25%",
          "chgp_class": "positive"
        }
      ]
    }
  }
]

Quarterly Results Snapshot (Consolidated) - Mar'26 - QoQstock-summary

Mar'26
Dec'25
Change(%)
Net Sales
338.44
202.64
67.02%
Operating Profit (PBDIT) excl Other Income
46.18
25.92
78.16%
Interest
6.66
4.16
60.10%
Exceptional Items
0.00
0.00
Consolidate Net Profit
32.65
17.98
81.59%
Operating Profit Margin (Excl OI)
13.64%
12.79%
0.85%
Values in Rs Cr.
Direction Arrows
Net Sales

QoQ Growth in quarter ended Mar 2026 is 67.02% vs 13.60% in Dec 2025

Direction Arrows
Consolidated Net Profit

QoQ Growth in quarter ended Mar 2026 is 81.59% vs 36.32% in Dec 2025

Half Yearly Results Snapshot (Consolidated) - Sep'25stock-summary

Sep'25
Sep'24
Change(%)
Net Sales
277.48
191.92
44.58%
Operating Profit (PBDIT) excl Other Income
19.80
21.38
-7.39%
Interest
6.47
5.75
12.52%
Exceptional Items
0.00
0.00
Consolidate Net Profit
14.15
14.12
0.21%
Operating Profit Margin (Excl OI)
7.14%
11.14%
-4.00%
Values in Rs Cr.
Direction Arrows
Net Sales

Growth in half year ended Sep 2025 is 44.58% vs 43.63% in Sep 2024

Direction Arrows
Consolidated Net Profit

Growth in half year ended Sep 2025 is 0.21% vs -12.30% in Sep 2024

Nine Monthly Results Snapshot (Consolidated) - Dec'25stock-summary

Dec'25
Dec'24
Change(%)
Net Sales
480.12
285.80
67.99%
Operating Profit (PBDIT) excl Other Income
45.72
28.08
62.82%
Interest
10.63
10.99
-3.28%
Exceptional Items
0.00
0.00
Consolidate Net Profit
32.13
16.96
89.45%
Operating Profit Margin (Excl OI)
9.52%
9.83%
-0.31%
Values in Rs Cr.
Direction Arrows
Net Sales

YoY Growth in nine months ended Dec 2025 is 67.99% vs 12.79% in Dec 2024

Direction Arrows
Consolidated Net Profit

YoY Growth in nine months ended Dec 2025 is 89.45% vs -63.13% in Dec 2024

Annual Results Snapshot (Consolidated) - Mar'26stock-summary

Mar'26
Mar'25
Change(%)
Net Sales
818.55
476.65
71.73%
Operating Profit (PBDIT) excl Other Income
91.90
42.82
114.62%
Interest
17.29
14.50
19.24%
Exceptional Items
0.00
0.00
Consolidate Net Profit
64.95
30.21
115.00%
Operating Profit Margin (Excl OI)
11.23%
8.98%
2.25%
Values in Rs Cr.
Direction Arrows
Net Sales

YoY Growth in year ended Mar 2026 is 71.73% vs -0.79% in Mar 2025

Direction Arrows
Consolidated Net Profit

YoY Growth in year ended Mar 2026 is 115.00% vs -51.78% in Mar 2025

stock-summaryCompany CV
About JNK India Ltd stock-summary
stock-summary
JNK India Ltd
Micro Cap
Industrial Manufacturing
JNK India Limited was incorporated as "JNK India Private Limited", a Private Limited Company in Thane, Maharashtra dated June 14, 2010, granted by the Registrar of Companies. The Company converted from a Private Company into a Public Company and the name was changed to "JNK India Limited", vide a fresh Certificate of Incorporation on May 26, 2023.
Company Coordinates stock-summary
Icon
No Company Details Available