
Compare Quest Laborato. with Similar Stocks
Dashboard
High Management Efficiency with a high ROE of 25.90%
Company has a Debt to Equity ratio (avg) of 0.09 times
Healthy long term growth as Operating profit has grown by an annual rate 30.53%
Flat results in Mar 26
With ROE of 16.7, it has a Very Attractive valuation with a 1.9 Price to Book Value
Increasing Participation by Institutional Investors
Below par performance in long term as well as near term
Stock DNA
Pharmaceuticals & Biotechnology
INR 164 Cr (Micro Cap)
11.00
35
0.00%
-0.19
16.70%
1.85
Total Returns (Price + Dividend) 
Quest Laborato. for the last several years.
Risk Adjusted Returns v/s
Returns Beta

News
Quest Laboratories Ltd is Rated Hold
Quest Laboratories Ltd is rated 'Hold' by MarketsMOJO, with this rating last updated on 30 May 2026. However, the analysis and financial metrics presented here reflect the stock's current position as of 24 June 2026, providing investors with an up-to-date view of the company’s fundamentals, valuation, financial trends, and technical outlook.
Read full news article
Quest Laboratories Ltd is Rated Hold
Quest Laboratories Ltd is rated 'Hold' by MarketsMOJO, with this rating last updated on 30 May 2026. However, the analysis and financial metrics discussed here reflect the stock's current position as of 12 June 2026, providing investors with the most up-to-date view of the company’s fundamentals, valuation, financial trends, and technical outlook.
Read full news article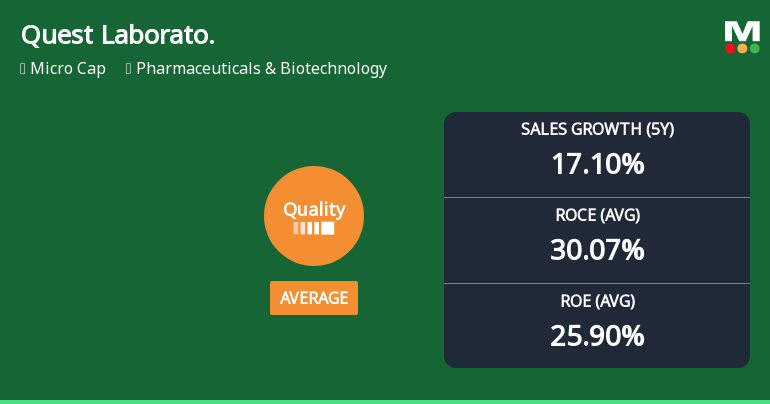
Quest Laboratories Ltd Downgraded to Hold as Quality Parameters Weaken
Quest Laboratories Ltd has recently experienced a downgrade in its quality grade from good to average, reflecting shifts in its core business fundamentals. This article analyses the key financial metrics, including return on equity (ROE), return on capital employed (ROCE), debt levels, and growth consistency, to understand the factors behind this change and its implications for investors.
Read full news article Announcements
Corporate Actions

No Upcoming Board Meetings

No Dividend history available

No Splits history available

No Bonus history available

No Rights history available
Quality key factors
Valuation key factors
Technicals key factors
 Technical Indicator Scale: Bearish, Mildly Bearish, Sideways, Mildly Bullish, Bullish Turned
 Shareholding Snapshot : Mar 2026
Shareholding Compare (%holding)
Promoters
None
Held by 0 Schemes
Held by 1 FIIs (0.61%)
Anil Kumar Sabarwal (62.8%)
Yashvi Hitesh Patel (3.41%)
26.98%
Quarterly Results Snapshot (Standalone) - Mar'26 - QoQ

QoQ Growth in quarter ended Mar 2026 is 5.85% vs 19.48% in Dec 2025
QoQ Growth in quarter ended Mar 2026 is -28.78% vs 0.25% in Dec 2025
Half Yearly Results Snapshot (Standalone) - Mar'26

Growth in half year ended Mar 2026 is 29.14% vs -20.38% in Sep 2025
Growth in half year ended Mar 2026 is -15.02% vs 46.04% in Sep 2025
Nine Monthly Results Snapshot (Standalone) - Dec'25
YoY Growth in nine months ended Dec 2025 is 38.18% vs -21.72% in Dec 2024
YoY Growth in nine months ended Dec 2025 is 47.09% vs -10.12% in Dec 2024
Annual Results Snapshot (Standalone) - Mar'26
YoY Growth in year ended Mar 2026 is 7.61% vs 25.86% in Mar 2025
YoY Growth in year ended Mar 2026 is 10.69% vs 34.49% in Mar 2025
About Quest Laboratories Ltd

Company Coordinates


