
Compare JHS Svend.Retail with Similar Stocks
Dashboard
With a Operating Losses, the company has a Weak Long Term Fundamental Strength
- Low ability to service debt as the company has a high Debt to EBITDA ratio of -6.19 times
- The company has reported losses. Due to this company has reported negative ROCE
Flat results in Dec 25
Risky - Negative EBITDA
Below par performance in long term as well as near term
Stock DNA
Diversified Retail
INR 14 Cr (Micro Cap)
104.00
74
0.00%
-0.02
0.58%
0.60
Total Returns (Price + Dividend) 
JHS Svend.Retail for the last several years.
Risk Adjusted Returns v/s
Returns Beta

News
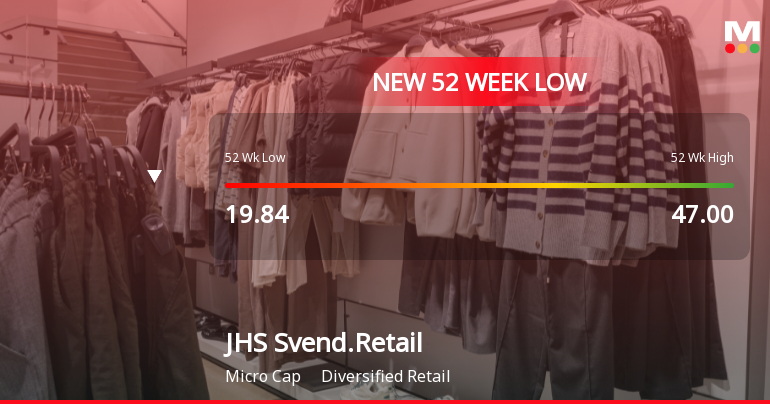
Markets Rally, But JHS Svendgaard Retail Ventures Ltd Sinks to 52-Week Low in Stock-Specific Sell-Off
Despite a broader market rebound, JHS Svendgaard Retail Ventures Ltd has plunged to a fresh 52-week low of Rs 16.36 on 30 Mar 2026, extending its recent losing streak and deepening its year-long decline of 54.83%.
Read full news article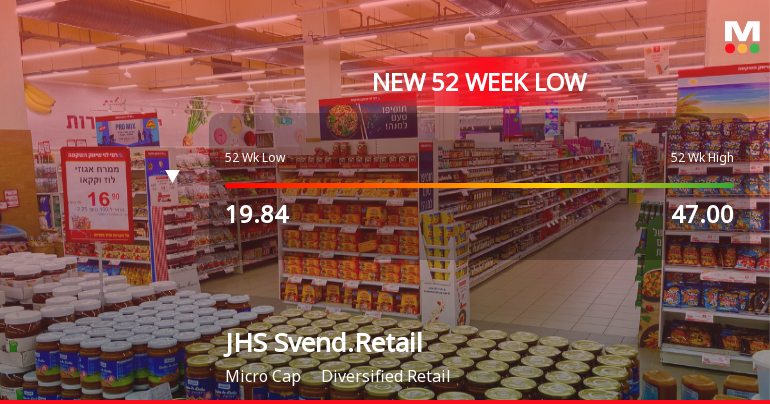
Markets Rally, But JHS Svendgaard Retail Ventures Ltd Sinks to 52-Week Low in Stock-Specific Sell-Off
A sharp decline of 6.59% on 27 Mar 2026 dragged JHS Svendgaard Retail Ventures Ltd to a fresh 52-week low of Rs 17.01, extending its downward trajectory despite broader market attempts at recovery.
Read full news article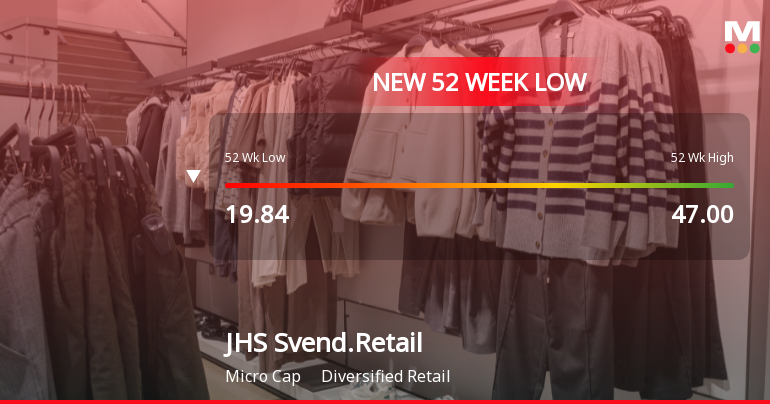
Markets Rally, But JHS Svendgaard Retail Ventures Ltd Sinks to 52-Week Low in Stock-Specific Sell-Off
Despite a broad market rally led by mega caps, JHS Svendgaard Retail Ventures Ltd has plunged to a fresh 52-week low of Rs 17.06 on 24 Mar 2026, marking a steep 52.39% decline over the past year and underperforming the Sensex by a wide margin.
Read full news article Announcements
Corporate Actions

No Upcoming Board Meetings

No Dividend history available

No Splits history available

No Bonus history available

No Rights history available
Quality key factors
Valuation key factors
Technicals key factors
 Technical Indicator Scale: Bearish, Mildly Bearish, Sideways, Mildly Bullish, Bullish Turned
 Shareholding Snapshot : Dec 2025
Shareholding Compare (%holding)
Non Institution
None
Held by 0 Schemes
Held by 0 FIIs
Nikhil Nanda (40.67%)
Let's Jump Trampoline And Adventure Private Limited (9.75%)
37.0%
Quarterly Results Snapshot (Standalone) - Dec'25 - QoQ

QoQ Growth in quarter ended Dec 2025 is 16.33% vs 21.34% in Sep 2025
QoQ Growth in quarter ended Dec 2025 is -320.00% vs 350.00% in Sep 2025
Half Yearly Results Snapshot (Standalone) - Sep'25
Growth in half year ended Sep 2025 is -0.41% vs 14.80% in Sep 2024
Growth in half year ended Sep 2025 is -79.31% vs 1,550.00% in Sep 2024
Nine Monthly Results Snapshot (Standalone) - Dec'25
YoY Growth in nine months ended Dec 2025 is 0.51% vs 22.72% in Dec 2024

YoY Growth in nine months ended Dec 2025 is 15.79% vs -211.76% in Dec 2024
Annual Results Snapshot (Standalone) - Mar'25
YoY Growth in year ended Mar 2025 is 23.68% vs 14.57% in Mar 2024
YoY Growth in year ended Mar 2025 is -52.00% vs -66.67% in Mar 2024
About JHS Svendgaard Retail Ventures Ltd

Company Coordinates


