
Compare Diensten Tech with Similar Stocks
Dashboard
Weak Long Term Fundamental Strength as the company has not declared results in the last 6 months
- High Debt Company with a Debt to Equity ratio (avg) of 6.09 times
- The company has been able to generate a Return on Equity (avg) of 1.35% signifying low profitability per unit of shareholders funds
With ROCE of 6.5, it has a Very Expensive valuation with a 2 Enterprise value to Capital Employed
Stock DNA
Computers - Software & Consulting
INR 99 Cr (Micro Cap)
NA (Loss Making)
NA
0.00%
2.91
4.05%
5.04
Total Returns (Price + Dividend) 
Diensten Tech for the last several years.
Risk Adjusted Returns v/s
Returns Beta

News

Diensten Tech Ltd is Rated Strong Sell
Diensten Tech Ltd is rated Strong Sell by MarketsMOJO, with this rating last updated on 18 June 2026. However, the analysis and financial metrics discussed here reflect the company’s current position as of 08 July 2026, providing investors with the latest insights into the stock’s performance and outlook.
Read full news article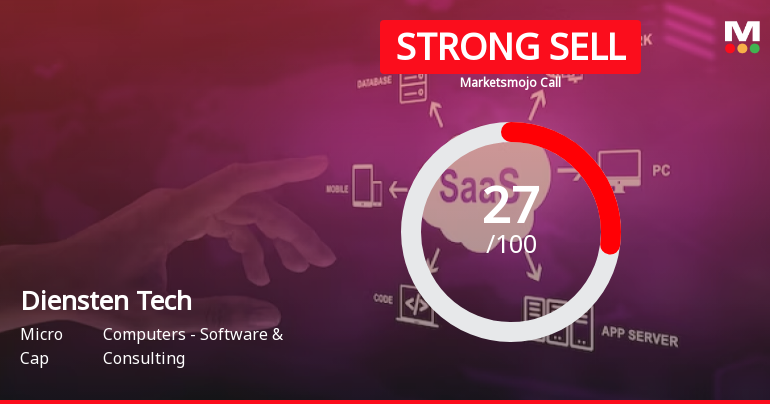
Diensten Tech Ltd is Rated Strong Sell
Diensten Tech Ltd is rated Strong Sell by MarketsMOJO, with this rating last updated on 18 June 2026. However, the analysis and financial metrics discussed here reflect the stock’s current position as of 27 June 2026, providing investors with the most up-to-date view of the company’s fundamentals, returns, and market standing.
Read full news article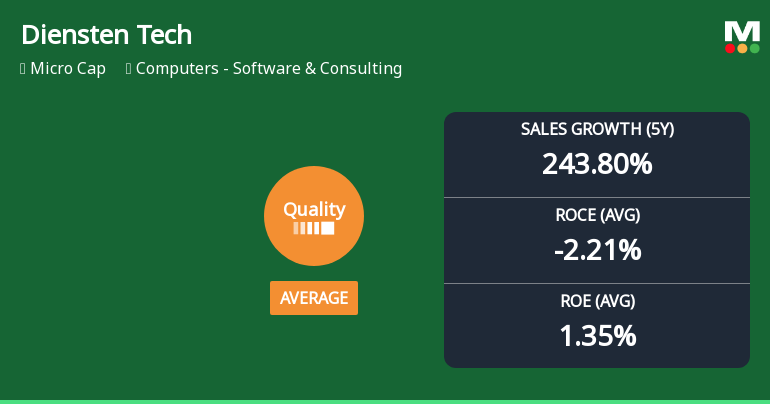
Diensten Tech Ltd Downgraded to Strong Sell Amid Deteriorating Quality Metrics
Diensten Tech Ltd, a micro-cap player in the Computers - Software & Consulting sector, has seen its quality grade downgraded from 'Average' to 'Below Average' with a corresponding Mojo Grade shift from Sell to Strong Sell as of 18 June 2026. This downgrade reflects a marked deterioration in key business fundamentals including return ratios, debt levels, and operational consistency, raising concerns about the company’s financial health and growth prospects.
Read full news article Announcements
Corporate Actions

No Upcoming Board Meetings

No Dividend history available

No Splits history available

No Bonus history available

No Rights history available
Quality key factors
Valuation key factors
Technicals key factors
 Technical Indicator Scale: Bearish, Mildly Bearish, Sideways, Mildly Bullish, Bullish Turned
 Shareholding Snapshot : Mar 2026
Shareholding Compare (%holding)
Promoters
None
Held by 0 Schemes
Held by 0 FIIs
Jk Traders Limited (49.82%)
Manoj Agarwal (2.18%)
18.42%
Quarterly Results Snapshot (Standalone) - Dec'25 - QoQ

QoQ Growth in quarter ended Dec 2025 is 91.81% vs 18.97% in Sep 2025

QoQ Growth in quarter ended Dec 2025 is 8.33% vs 11.11% in Sep 2025
Half Yearly Results Snapshot (Standalone) - Mar'26
Growth in half year ended Mar 2026 is 124.57% vs 24.21% in Sep 2025
Growth in half year ended Mar 2026 is 241.18% vs -30.77% in Sep 2025
Nine Monthly Results Snapshot (Standalone) - Dec'25
YoY Growth in nine months ended Dec 2025 is 61.00% vs 89.27% in Dec 2025
YoY Growth in nine months ended Dec 2025 is 168.49% vs -14.96% in Dec 2025
Annual Results Snapshot (Standalone) - Mar'25
YoY Growth in year ended Mar 2025 is 58.31% vs 9.17% in Mar 2024
YoY Growth in year ended Mar 2025 is 24.01% vs -1,843.75% in Mar 2024
About Diensten Tech Ltd

Company Coordinates


