
Compare Ola Electric with Similar Stocks
Dashboard
With a Operating Losses, the company has a Weak Long Term Fundamental Strength
- Poor long term growth as Operating profit has grown by an annual rate -38.66% of over the last 5 years
- Company's ability to service its debt is weak with a poor EBIT to Interest (avg) ratio of -5.63
The company has declared Negative results for the last 6 consecutive quarters
Risky - Negative EBITDA
Reducing Promoter Confidence
Below par performance in long term as well as near term
Stock DNA
Automobiles
INR 10,736 Cr (Small Cap)
NA (Loss Making)
31
0.00%
0.04
-52.51%
2.40
Total Returns (Price + Dividend) 
Ola Electric for the last several years.
Risk Adjusted Returns v/s
Returns Beta

News
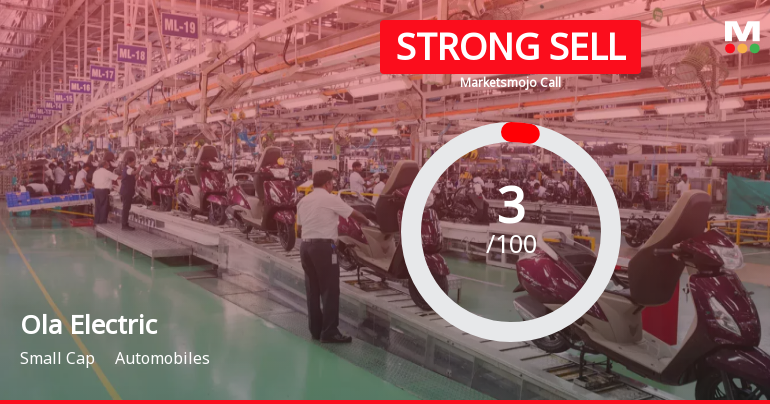
Ola Electric Mobility Ltd is Rated Strong Sell
Ola Electric Mobility Ltd is rated Strong Sell by MarketsMOJO, with this rating last updated on 08 Nov 2024. However, the analysis and financial metrics presented here reflect the company’s current position as of 17 March 2026, providing investors with an up-to-date view of its fundamentals, returns, and overall market standing.
Read full news article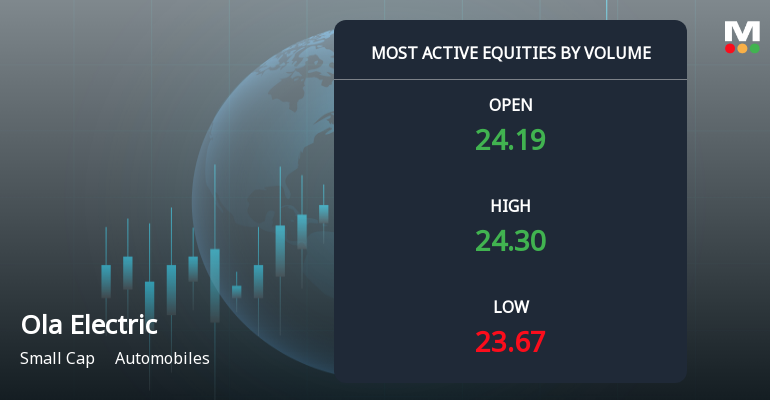
Ola Electric Mobility Ltd Sees Exceptional Volume Amid Bearish Sentiment
Ola Electric Mobility Ltd (OLAELEC) emerged as one of the most actively traded stocks on 17 Mar 2026, registering a total traded volume exceeding 1.03 crore shares. Despite this surge in activity, the stock underperformed its sector and broader market indices, reflecting a complex interplay of investor sentiment and technical factors.
Read full news article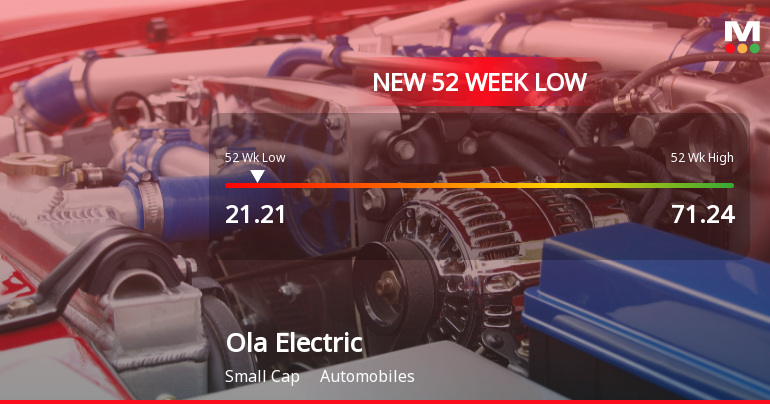
Ola Electric Mobility Ltd Stock Falls to 52-Week Low Amid Market Volatility
Ola Electric Mobility Ltd’s stock has declined to a fresh 52-week low, closing near Rs 22.25, marking a significant drop from its previous highs and reflecting ongoing pressures within the automobile sector and broader market conditions.
Read full news article Announcements
Corporate Actions

No Upcoming Board Meetings

No Dividend history available

No Splits history available

No Bonus history available

No Rights history available
Quality key factors
Valuation key factors
Technicals key factors
 Technical Indicator Scale: Bearish, Mildly Bearish, Sideways, Mildly Bullish, Bullish Turned
 Shareholding Snapshot : Dec 2025
Shareholding Compare (%holding)
Non Institution
None
Held by 19 Schemes (5.54%)
Held by 87 FIIs (4.08%)
Bhavish Aggarwal (27.83%)
Svf Ii Ostrich (de) Llc (14.04%)
29.74%
Quarterly Results Snapshot (Consolidated) - Dec'25 - QoQ

QoQ Growth in quarter ended Dec 2025 is -31.88% vs -16.67% in Sep 2025
QoQ Growth in quarter ended Dec 2025 is -16.51% vs 2.34% in Sep 2025
Half Yearly Results Snapshot (Consolidated) - Sep'25
Growth in half year ended Sep 2025 is -46.89% vs 35.07% in Sep 2024

Growth in half year ended Sep 2025 is -0.48% vs -6.31% in Sep 2024
Nine Monthly Results Snapshot (Consolidated) - Dec'25
YoY Growth in nine months ended Dec 2025 is -49.06% vs 14.39% in Dec 2024
YoY Growth in nine months ended Dec 2025 is 5.19% vs -20.38% in Dec 2024
Annual Results Snapshot (Consolidated) - Mar'25
YoY Growth in year ended Mar 2025 is -9.90% vs 90.43% in Mar 2024
YoY Growth in year ended Mar 2025 is -43.69% vs -7.60% in Mar 2024
About Ola Electric Mobility Ltd

Company Coordinates


