
 Price Point
Compare Indogulf Cropsci with Similar Stocks
ScoreDashboard
Low ability to service debt as the company has a high Debt to EBITDA ratio of 3.16 times
- Low ability to service debt as the company has a high Debt to EBITDA ratio of 3.16 times
- The company has been able to generate a Return on Equity (avg) of 13.49% signifying low profitability per unit of shareholders funds
Poor long term growth as Net Sales has grown by an annual rate of 7.30% and Operating profit at 9.70% over the last 5 years
Negative results in Jun 26
With ROCE of 9.9, it has a Very Attractive valuation with a 1 Enterprise value to Capital Employed
Majority shareholders : Promoters
Underperformed the market in the last 1 year


 Total Returns
Total Returns (Price + Dividend) 
Indogulf Cropsci for the last several years.
Risk Adjusted Returns v/s
Returns Beta
 News & Corporate Actions
News
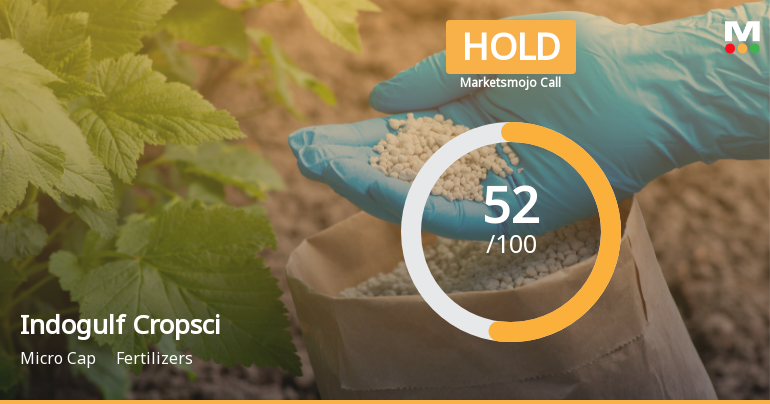
Indogulf Cropsciences Ltd Upgraded to Hold as Technicals Improve Despite Financial Challenges
Indogulf Cropsciences Ltd has seen its investment rating upgraded from Sell to Hold, driven primarily by a marked improvement in technical indicators and an attractive valuation despite recent financial challenges. The company’s micro-cap status and sector dynamics in fertilizers continue to influence investor sentiment as it navigates a mixed performance landscape.
Read full news article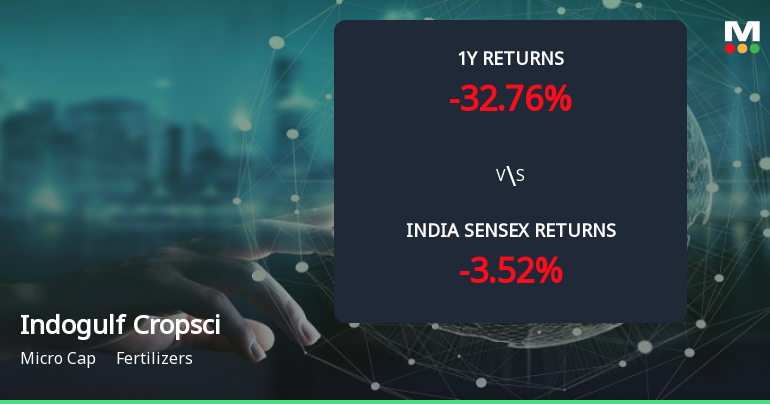
Golden Cross Forms in Indogulf Cropsciences Ltd — On a Day the Stock Fell 0.39%. What the Mixed Signals Mean
The 50-day moving average has crossed above the 200-day moving average for Indogulf Cropsciences Ltd, signalling a golden cross on 28 Aug 2026. Yet, the stock declined 0.39% on the day this technical event occurred, while monthly momentum indicators remain absent or bearish. This divergence between the moving averages and price action demands a closer look at the broader technical and fundamental context.
Read full news article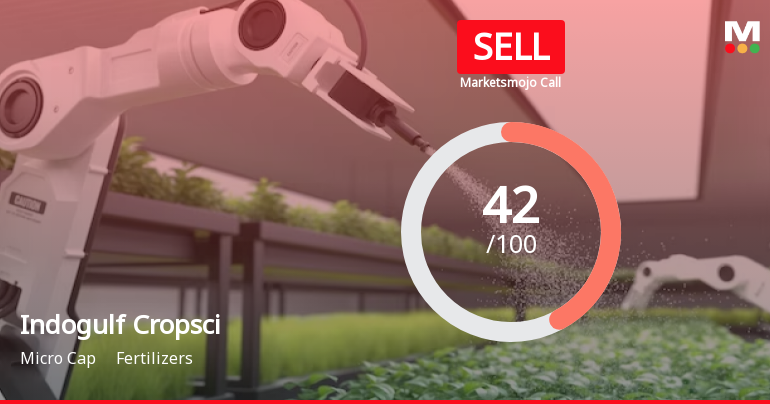
Indogulf Cropsciences Ltd is Rated Sell
Indogulf Cropsciences Ltd is rated 'Sell' by MarketsMOJO, with this rating last updated on 12 August 2026. However, the analysis and financial metrics discussed here reflect the stock's current position as of 21 August 2026, providing investors with the most recent insights into the company’s performance and outlook.
Read full news article Announcements
Corporate Actions

No Upcoming Board Meetings

No Dividend history available

No Splits history available

No Bonus history available

No Rights history available
Key FactorsQuality key factors
Valuation key factors
Technicals key factors
 Technical Indicator Scale: Bearish, Mildly Bearish, Sideways, Mildly Bullish, Bullish Turned Shareholding
Shareholding Snapshot : Jun 2026
Shareholding Compare (%holding)
Promoters
None
Held by 0 Schemes
Held by 4 FIIs (0.23%)
Sanjay Aggarwal (20.24%)
Abakkus Diversified Alpha Fund (4.02%)
20.29%
FinancialQuarterly Results Snapshot (Consolidated) - Jun'26 - QoQ
 Compare with Peers
QoQ Growth in quarter ended Jun 2026 is 11.76% vs 29.91% in Mar 2026
QoQ Growth in quarter ended Jun 2026 is -79.24% vs 200.78% in Mar 2026

Half Yearly Results Snapshot (Standalone) - Sep'25
Not Applicable: The company has declared_date for only one period
Not Applicable: The company has declared_date for only one period
Nine Monthly Results Snapshot (Standalone) - Dec'25
Not Applicable: The company has declared_date for only one period
Not Applicable: The company has declared_date for only one period
Annual Results Snapshot (Consolidated) - Mar'26

YoY Growth in year ended Mar 2026 is 19.34% vs 6.92% in Mar 2025
YoY Growth in year ended Mar 2026 is 27.20% vs 11.48% in Mar 2025
 Company CV
About Indogulf Cropsciences Ltd

Company Coordinates








