
Compare Indiqube Spaces with Similar Stocks
Dashboard
With HIgh Debt (Debt-Equity Ratio at 9.37 times)- the company has a Weak Long Term Fundamental Strength
- Poor long term growth as Net Sales has grown by an annual rate of 27.50% and Operating profit at 0% over the last 5 years
- The company is Net-Debt Free
With ROCE of 4.4, it has a Expensive valuation with a 1.6 Enterprise value to Capital Employed
Stock DNA
Diversified Commercial Services
INR 3,709 Cr (Small Cap)
NA (Loss Making)
33
0.00%
9.37
-20.66%
7.11
Total Returns (Price + Dividend) 
Indiqube Spaces for the last several years.
Risk Adjusted Returns v/s
Returns Beta

News
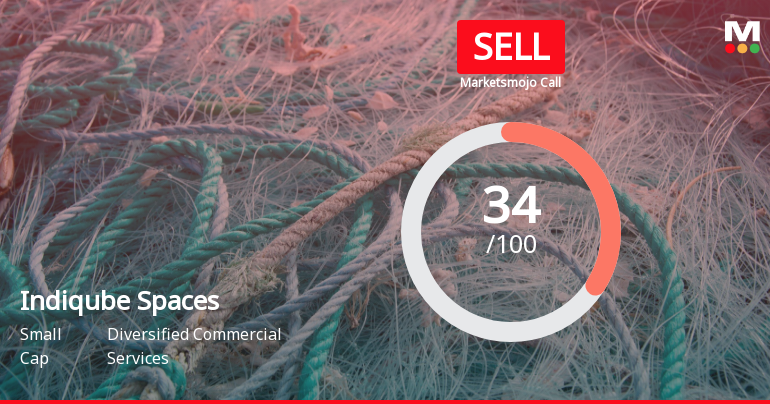
Indiqube Spaces Ltd is Rated Sell
Indiqube Spaces Ltd is rated 'Sell' by MarketsMOJO, with this rating last updated on 13 July 2026. While the rating change occurred on that date, the analysis and financial metrics discussed here reflect the company’s current position as of 14 July 2026, providing investors with the most up-to-date insight into the stock’s fundamentals and market performance.
Read full news article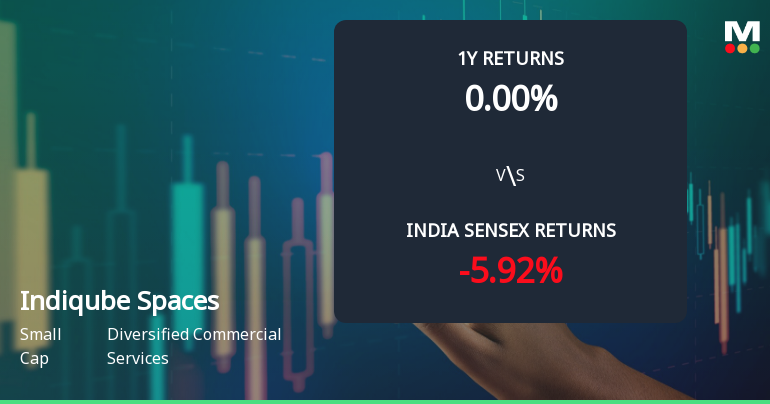
Indiqube Spaces Ltd Technical Momentum Shifts Amid Mixed Market Signals
Indiqube Spaces Ltd has experienced a notable shift in its technical momentum, moving from a mildly bearish stance to a more sideways trend, reflecting a complex interplay of technical indicators. Despite a recent downgrade in its Mojo Grade to 'Sell' from 'Strong Sell', the stock’s price action and momentum oscillators suggest a nuanced outlook for investors navigating the diversified commercial services sector.
Read full news article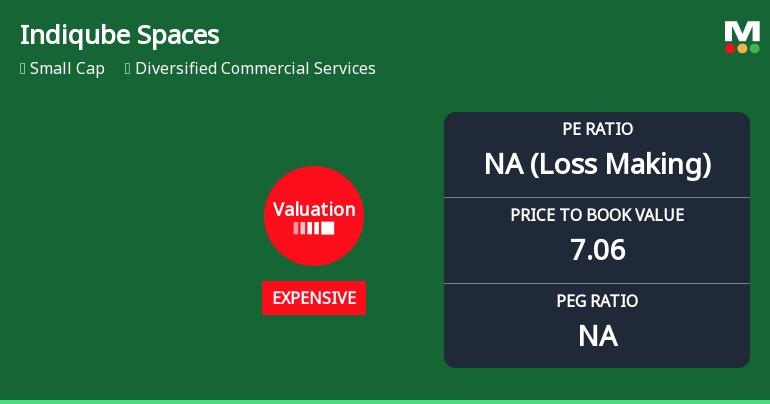
Indiqube Spaces Ltd Valuation Shifts Signal Growing Price Pressure
Indiqube Spaces Ltd, a small-cap player in the diversified commercial services sector, has seen its valuation parameters shift notably, with its price-to-earnings (P/E) ratio plunging to -34.19 and price-to-book value (P/BV) rising to 7.06. These changes have pushed the company’s valuation grade from fair to expensive, raising questions about price attractiveness amid subdued returns and challenging fundamentals.
Read full news article Announcements
Corporate Actions

No Upcoming Board Meetings

No Dividend history available

No Splits history available

No Bonus history available

No Rights history available
Quality key factors
Valuation key factors
Technicals key factors
 Technical Indicator Scale: Bearish, Mildly Bearish, Sideways, Mildly Bullish, Bullish Turned
 Shareholding Snapshot : Mar 2026
Shareholding Compare (%holding)
Promoters
None
Held by 8 Schemes (9.21%)
Held by 13 FIIs (2.18%)
Anshuman Das (21.81%)
Aravali Investment Holdings (19.14%)
2.77%
Quarterly Results Snapshot (Standalone) - Mar'26 - QoQ

QoQ Growth in quarter ended Mar 2026 is 2.95% vs 11.37% in Dec 2025
QoQ Growth in quarter ended Mar 2026 is -32.69% vs 42.85% in Dec 2025
Half Yearly Results Snapshot (Standalone) - Sep'25
Not Applicable: The company has declared_date for only one period
Not Applicable: The company has declared_date for only one period
Nine Monthly Results Snapshot (Standalone) - Dec'25
Not Applicable: The company has declared_date for only one period
Not Applicable: The company has declared_date for only one period
Annual Results Snapshot (Standalone) - Mar'26

YoY Growth in year ended Mar 2026 is 36.96% vs 27.54% in Mar 2025
YoY Growth in year ended Mar 2026 is 23.84% vs 59.12% in Mar 2025
About Indiqube Spaces Ltd

Company Coordinates


