
Compare Mawana Sugars with Similar Stocks
Dashboard
Weak Long Term Fundamental Strength with a -0.06% CAGR growth in Net Sales over the last 5 years
- Low ability to service debt as the company has a high Debt to EBITDA ratio of 0.08 times
- The company has been able to generate a Return on Equity (avg) of 8.29% signifying low profitability per unit of shareholders funds
Positive results in Mar 26
With ROE of 8.9, it has a Very Attractive valuation with a 0.9 Price to Book Value
Majority shareholders : Promoters
Total Returns (Price + Dividend) 
Latest dividend: 1 per share ex-dividend date: Jun-20-2025
Risk Adjusted Returns v/s
Returns Beta

News
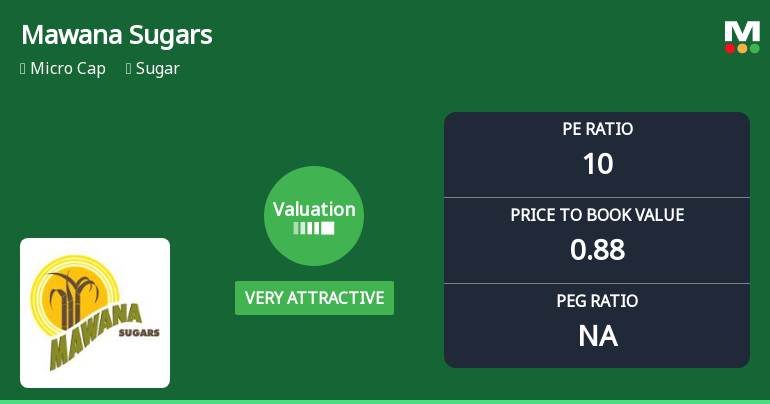
Mawana Sugars Ltd Valuation Shifts Signal Renewed Price Attractiveness
Mawana Sugars Ltd has witnessed a significant shift in its valuation parameters, moving from an attractive to a very attractive rating, driven by a notable decline in its price-to-earnings (P/E) and price-to-book value (P/BV) ratios. This recalibration in valuation metrics, coupled with solid operational returns, positions the micro-cap sugar company as a compelling consideration for investors seeking value in the sector amid mixed market conditions.
Read full news article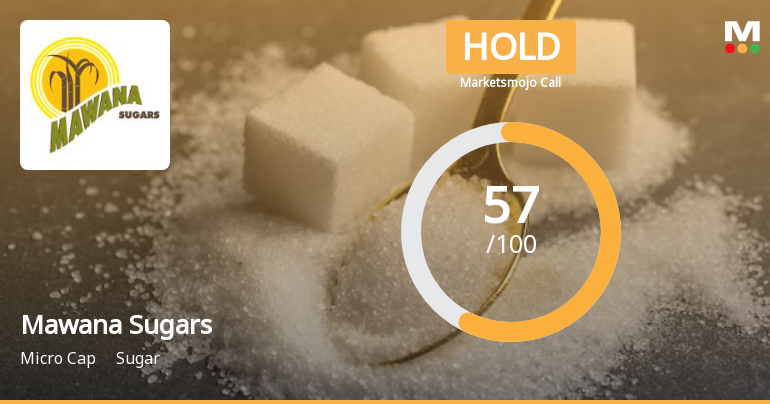
Mawana Sugars Ltd is Rated Hold by MarketsMOJO
Mawana Sugars Ltd is rated 'Hold' by MarketsMOJO, with this rating last updated on 25 May 2026. However, the analysis and financial metrics discussed here reflect the stock's current position as of 10 June 2026, providing investors with an up-to-date perspective on the company’s fundamentals, valuation, financial trends, and technical outlook.
Read full news article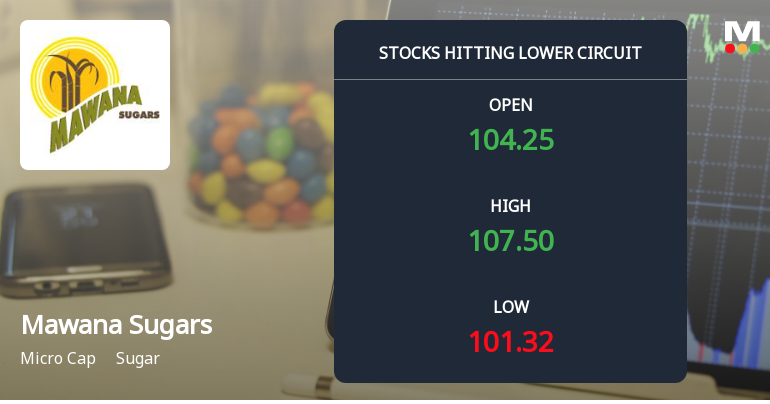
Mawana Sugars Ltd Locks at Lower Circuit With 5% Loss — Sellers Queue, No Buyers in Sight
At Rs 102, sellers were still queuing — but there were no buyers willing to take the other side. Mawana Sugars Ltd locked at its lower circuit of 5% on 9 Jun 2026, with unfilled sell orders and a frozen price, signalling persistent selling pressure in a micro-cap stock with limited liquidity.
Read full news article Announcements
Mawana Sugars Limited - Other General Purpose
03-Dec-2019 | Source : NSEMawana Sugars Limited has informed the Exchange regarding Disclosure of Related Party Transaction under Regulation 23(9) of the SEBI (Listing Obligations and Disclosure Requirements) Regulations, 2015.
Mawana Sugars Limited - Updates
04-Nov-2019 | Source : NSEMawana Sugars Limited has informed the Exchange regarding 'Commencement of Crushing season 2019-2020
Updates
02-Sep-2019 | Source : NSE
| Mawana Sugars Limited has informed the Exchange regarding 'Intimation under Regulation 30 of Securities and Exchange Board of India (Listing Obligations and Disclosures) Requirements, 2015'. |
Corporate Actions

No Upcoming Board Meetings

Mawana Sugars Ltd has declared 40% dividend, ex-date: 25 Jun 26

No Splits history available

No Bonus history available

No Rights history available
Quality key factors
Valuation key factors
Technicals key factors
 Technical Indicator Scale: Bearish, Mildly Bearish, Sideways, Mildly Bullish, Bullish Turned
 Shareholding Snapshot : Mar 2026
Shareholding Compare (%holding)
Promoters
None
Held by 6 Schemes (0.03%)
Held by 4 FIIs (0.55%)
Mr.krishna Shriram (62.93%)
None
33.14%
Quarterly Results Snapshot (Consolidated) - Mar'26 - QoQ

QoQ Growth in quarter ended Mar 2026 is 2.01% vs -14.44% in Dec 2025
QoQ Growth in quarter ended Mar 2026 is 1,498.73% vs 124.36% in Dec 2025
Half Yearly Results Snapshot (Consolidated) - Sep'25

Growth in half year ended Sep 2025 is 7.84% vs 8.81% in Sep 2024
Growth in half year ended Sep 2025 is -19.83% vs 8.43% in Sep 2024
Nine Monthly Results Snapshot (Consolidated) - Dec'25
YoY Growth in nine months ended Dec 2025 is 8.42% vs 6.85% in Dec 2024
YoY Growth in nine months ended Dec 2025 is -153.91% vs 606.36% in Dec 2024
Annual Results Snapshot (Consolidated) - Mar'26
YoY Growth in year ended Mar 2026 is 8.60% vs 6.74% in Mar 2025
YoY Growth in year ended Mar 2026 is -66.10% vs 190.62% in Mar 2025
About Mawana Sugars Ltd

Company Coordinates


