Ashoka Buildcon

  • Market Cap: Small Cap
  • Industry: Construction
  • ISIN: INE442H01029
  • NSEID: ASHOKA
  • BSEID: 533271
INR
124.79
1.35 (1.09%)
BSENSE

May 25

BSE+NSE Vol: 4.92 lacs

  • Price Points
  • Score
  • Mojo Parameters
  • Total Return
  • News and Corporate Actions
  • Key factors
  • Shareholding
  • Financials
  • CompanyCV
stock-summaryPrice Point
High/Low

1Day

52 Week

Valuation
Technical
Day's Volume

CASH

4.92 lacs (44.08%) Volume

Shareholding (Mar 2026)

FII

5.90%

Held by 78 FIIs

DII

14.39%

Held by 20 DIIs

Promoter

54.48%

Is Ashoka Buildcon overvalued or undervalued?

09-Jun-2025

As of August 22, 2024, Ashoka Buildcon is considered very attractive and undervalued with a PE ratio of 3.70 and strong growth potential, especially when compared to peers like Rail Vikas and Tube Investments, despite a year-to-date return of -28.51% and a robust 3-year return of 169.27%.

As of 22 August 2024, the valuation grade for Ashoka Buildcon has moved from attractive to very attractive, indicating a significant positive shift in its perceived value. The company is currently considered undervalued, with a PE ratio of 3.70, an EV to EBITDA ratio of 2.63, and a PEG ratio of 0.01, all of which suggest strong potential for growth relative to its price. <BR><BR>In comparison to its peers, Ashoka Buildcon stands out with its low valuation metrics; for instance, Rail Vikas has a PE ratio of 69.76 and an EV to EBITDA of 80.38, categorizing it as very expensive. Similarly, Tube Investments shows a PE of 87.5, reinforcing Ashoka Buildcon's attractive positioning in the market. Despite a year-to-date return of -28.51%, the company has demonstrated resilience with a 3-year return of 169.27%, significantly outperforming the Sensex's 49.15% over the same period, further supporting the view that Ashoka Buildcon is undervalued.

View full answer

Who are in the management team of Ashoka Buildcon?

06-Jun-2025

As of March 2023, the management team of Ashoka Buildcon includes Executive Chairman Ashok M Katariya, Managing Director Satish D Parakh, and several non-executive and independent directors, totaling ten key members who guide the company's governance and strategy.

As of March 2023, the management team of Ashoka Buildcon includes the following individuals:<BR><BR>1. Ashok M Katariya - Executive Chairman<BR>2. Satish D Parakh - Managing Director<BR>3. Sharad D Abhyankar - Non-Executive & Independent Director<BR>4. Manoj A Kulkarni - Company Secretary & Compliance Officer<BR>5. Albert Tauro - Non-Executive & Independent Director<BR>6. Sanjay Londhe - Whole-time Director<BR>7. Gyan Chand Daga - Non-Executive & Independent Director<BR>8. Ashish Ashok Katariya - Non-Executive & Non-Independent Director<BR>9. Mahendra Mehta - Non-Executive & Independent Director<BR>10. Shilpa Hiran - Independent Director<BR><BR>This team comprises a mix of executive, non-executive, and independent directors, contributing to the governance and strategic direction of the company.

View full answer

What does Ashoka Buildcon do?

06-Jun-2025

Ashoka Buildcon Ltd. is a mid-cap construction company focused on infrastructure development through Engineering, Procurement and Construction (EPC) and Built, Operate and Transfer (BOT) models. As of March 2025, it reported net sales of ₹2,694 Cr and a net profit of ₹432 Cr.

Overview: <BR>Ashoka Buildcon Ltd. is engaged in the construction of infrastructure facilities on an Engineering, Procurement and Construction (EPC) basis and Built, Operate and Transfer (BOT) basis, operating within the mid-cap construction industry.<BR><BR>History: <BR>Incorporated in May 1993, Ashoka Buildcon Ltd. has been involved in infrastructure development and reported its latest quarterly results for March 2025, showcasing net sales and profit figures.<BR><BR>Financial Snapshot: <BR>Most recent Net Sales: 2,694 Cr (Quarterly Results - Mar 2025) <BR>Most recent Net Profit: 432 Cr (Quarterly Results - Mar 2025) <BR>Market-cap value: Rs 6,260 Cr (Mid Cap)<BR><BR>Key Metrics: <BR>P/E: 4.00 <BR>Industry P/E: 34 <BR>Dividend Yield: 0.00% <BR>Debt-Equity: 0.36 <BR>Return on Equity: 43.27% <BR>Price to Book: 1.57<BR><BR>Contact Details: <BR>Address: Survey No 861 Ashoka House, Ashok Marg Vadala Nashik Maharashtra : 422011 <BR>Tel: 91-253-3011705 <BR>Email: investors@ashokabuildcon.com <BR>Website: http://www.ashokabuildcon.com

View full answer

What is the bonus history of the Ashoka Buildcon?

06-Jun-2025

Ashoka Buildcon has a history of issuing bonuses, with the most recent being a 1:1 bonus on July 12, 2018, and a previous 1:2 bonus on July 3, 2013, demonstrating its commitment to rewarding shareholders.

Ashoka Buildcon has a notable bonus history. The most recent bonus issue was a 1:1 bonus announced with an ex-date of July 12, 2018, and a record date of July 13, 2018. Prior to that, the company issued a 1:2 bonus on July 3, 2013, with a record date of July 4, 2013. This indicates that Ashoka Buildcon has actively engaged in bonus issues to reward its shareholders in the past.

View full answer

Has Ashoka Buildcon declared dividend?

06-Jun-2025

Yes, Ashoka Buildcon Ltd. has declared a dividend of 16% (₹0.8 per share) with an ex-date of March 27, 2018. However, the dividend yield is currently 0%, and while there have been significant price returns over various periods, no dividends have been paid in recent years.

Ashoka Buildcon Ltd. has declared a dividend.<BR><BR>Dividend Details:<BR>- Percentage announced: 16%<BR>- Amount per share: 0.8<BR>- Ex-date: 27 Mar 18<BR><BR>Dividend Yield: 0%<BR><BR>Total Returns by Period:<BR>In the 6 months period, the price return was -19.51%, the dividend return was 0%, resulting in a total return of -19.51%.<BR><BR>In the 1 year period, the price return was 19.26%, the dividend return was 0%, resulting in a total return of 19.26%.<BR><BR>In the 2 years period, the price return was 175.08%, the dividend return was 0%, resulting in a total return of 175.08%.<BR><BR>In the 3 years period, the price return was 159.23%, the dividend return was 0%, resulting in a total return of 159.23%.<BR><BR>In the 4 years period, the price return was 139.74%, the dividend return was 0%, resulting in a total return of 139.74%.<BR><BR>In the 5 years period, the price return was 321.13%, the dividend return was 0%, resulting in a total return of 321.13%.<BR><BR>Overall, Ashoka Buildcon has declared a dividend, but the dividend yield is currently 0%. The total returns over various periods indicate significant price appreciation, especially over the longer term, despite the lack of dividends in recent years.

View full answer

Who are the peers of the Ashoka Buildcon?

03-Jun-2025

Peers of Ashoka Buildcon include Larsen & Toubro, Rail Vikas, Altius Telecom, NBCC, IRB Infra.Devl., Man Infra, Hind.Construct., KNR Construct., Energy InfrTrust, and Bondada Engineer. In terms of management risk, growth, and capital structure, Ashoka Buildcon shows good performance but has a below-average capital structure compared to its peers.

Peers: The peers of Ashoka Buildcon are Larsen & Toubro, Rail Vikas, Altius Telecom, NBCC, IRB Infra.Devl., Man Infra, Hind.Construct., KNR Construct., Energy InfrTrust, and Bondada Engineer.<BR><BR>Quality Snapshot: Excellent management risk is observed at NBCC, Man Infra, and Ashoka Buildcon, while Good management risk is found at Larsen & Toubro, Altius Telecom, and KNR Construct. Average management risk is noted for Rail Vikas, IRB Infra.Devl., and Hind.Construct., while Below Average management risk is seen at Energy InfrTrust and Bondada Engineer. Growth is Excellent for Altius Telecom and Man Infra, Good for NBCC and Ashoka Buildcon, Average for KNR Construct, and Below Average for Rail Vikas, IRB Infra.Devl., and Hind.Construct. Capital Structure is Excellent for NBCC and Man Infra, Good for KNR Construct, Below Average for Ashoka Buildcon, Altius Telecom, IRB Infra.Devl., and Hind.Construct., and Average for Rail Vikas and Energy InfrTrust.<BR><BR>Return Snapshot: The peer with the highest 1-year return is NBCC at 24.00%, while the lowest is IRB Infra.Devl. at -29.96%. Ashoka Buildcon's 1-year return is 10.53%, which is higher than IRB Infra.Devl. but lower than NBCC. Additionally, the six-month return is negative for IRB Infra.Devl., Man Infra, Hind.Construct., KNR Construct., and Energy InfrTrust.

View full answer

Who are the top shareholders of the Ashoka Buildcon?

17-Jul-2025

The top shareholders of Ashoka Buildcon include promoters holding the majority, with Shobha Parakh at 13.55%, mutual funds at 14.16%, foreign institutional investors at 7.29%, and individual investors at 21.01%. The largest public shareholder is HDFC Trustee Company Ltd. with 6.23%.

The top shareholders of Ashoka Buildcon include a mix of promoters, mutual funds, and individual investors. The majority of the shares are held by promoters, with Shobha Parakh being the promoter with the highest holding at 13.55%. Mutual funds collectively hold 14.16% of the shares across 17 schemes, while foreign institutional investors (FIIs) own 7.29% through 125 different entities. The highest public shareholder is HDFC Trustee Company Ltd., which manages the HDFC Balanced Advantage Fund, holding 6.23%. Additionally, individual investors account for 21.01% of the total shareholding.

View full answer

How big is Ashoka Buildcon?

24-Jul-2025

As of 24th July, Ashoka Buildcon Ltd. has a market capitalization of 5,725.00 Cr, with recent net sales of 10,036.63 Cr and net profit of 1,694.11 Cr over the last four quarters.

As of 24th July, <BR><BR>Market Cap: Ashoka Buildcon Ltd. has a market capitalization of 5,725.00 Cr, categorizing it as a Mid Cap company.<BR><BR>Recent Quarterly Performance: The sum of Net Sales for the latest 4 quarters is 10,036.63 Cr, while the sum of Net Profit for the same period is 1,694.11 Cr.<BR><BR>Balance Sheet Snapshot: The reporting period is the latest annual period ending March 2024. Shareholder's Funds stand at 2,220.25 Cr, and Total Assets are valued at 19,005.17 Cr.

View full answer

How has been the historical performance of Ashoka Buildcon?

14-Nov-2025

Ashoka Buildcon has shown significant growth from 2019 to 2025, with net sales increasing from ₹4,930.12 crore to ₹10,036.63 crore, and profit after tax rising from a loss of ₹39.23 crore to a profit of ₹1,732.66 crore. The company's earnings per share improved from -1.19 to 60.35, reflecting enhanced shareholder value.

Answer:<BR>The historical performance of Ashoka Buildcon shows significant growth in various financial metrics over the years, particularly from 2019 to 2025.<BR><BR>Breakdown:<BR>Ashoka Buildcon's net sales have steadily increased from 4,930.12 crore in March 2019 to 10,036.63 crore in March 2025, reflecting a strong upward trend. Total operating income followed a similar trajectory, rising from 4,930.12 crore in March 2019 to 10,036.63 crore in March 2025. The company's operating profit (PBDIT) also saw substantial growth, climbing from 1,471.37 crore in March 2019 to 3,088.89 crore in March 2025. Profit before tax increased significantly from 131.67 crore in March 2019 to 1,553.87 crore in March 2025, while profit after tax surged from a loss of 39.23 crore in March 2019 to a profit of 1,732.66 crore in March 2025. The earnings per share (EPS) improved dramatically from -1.19 in March 2019 to 60.35 in March 2025, indicating enhanced shareholder value. On the balance sheet, total assets rose from 13,551.19 crore in March 2019 to 20,170.01 crore in March 2025, while total liabilities increased from 13,551.19 crore to 20,170.01 crore over the same period. Cash flow from operating activities improved from 1,069 crore in March 2020 to 1,673 crore in March 2025, although the net cash inflow/outflow showed a decline to -4 crore in March 2025 from a positive 599 crore in March 2024. Overall, Ashoka Buildcon has demonstrated robust growth in revenue and profitability, alongside a solid balance sheet position over the years.

View full answer

Is Ashoka Buildcon technically bullish or bearish?

02-Dec-2025

As of December 1, 2025, Ashoka Buildcon's technical stance is bearish, driven by indicators such as a bearish MACD, Bollinger Bands, and moving averages, with only mild bullish signals from the KST suggesting divergence.

As of 1 December 2025, the technical trend has changed from mildly bearish to bearish. The current technical stance for Ashoka Buildcon is bearish with a moderate strength. Key indicators driving this stance include a bearish MACD on the weekly timeframe, bearish Bollinger Bands on both weekly and monthly timeframes, and a bearish moving average on the daily timeframe. The KST shows a mildly bullish signal on the weekly but is mildly bearish on the monthly, indicating some divergence. Overall, the lack of strong bullish signals in the RSI and the absence of trends in Dow Theory and OBV further support the bearish outlook.

View full answer

When is the next results date for Ashoka Buildcon Ltd.?

13-May-2026

The next results date for Ashoka Buildcon Ltd. is 21 May 2026.

The next results date for Ashoka Buildcon Ltd. is scheduled for 21 May 2026.

View full answer

Are Ashoka Buildcon Ltd. latest results good or bad?

22-May-2026

Ashoka Buildcon Ltd.'s latest results are unfavorable, with net sales down 27.47% and net profit down 66.88% year-on-year, indicating significant operational challenges and declining profitability despite a strong return on equity. The company needs to address these issues to restore investor confidence.

Ashoka Buildcon Ltd.'s latest results indicate a concerning performance for the company. In the quarter ending March 2026, net sales fell by 27.47% year-on-year to ₹1,954.30 crores, and net profit plummeted by 66.88% to ₹143.14 crores. This significant decline in profitability is compounded by a severe contraction in operating margins, which dropped to 13.48% from 28.84% in the same quarter last year.<BR><BR>The results suggest that the company is facing serious operational challenges, including pricing pressure and potential cost overruns on projects. Although there was a slight sequential improvement in revenue compared to the previous quarter, the overall trend remains negative, raising concerns about the sustainability of its profitability.<BR><BR>While Ashoka Buildcon maintains a strong return on equity of 38.03%, the drastic decline in margins and profits indicates that the company needs to address its operational issues to restore investor confidence. Overall, the latest results are viewed as unfavorable, highlighting the need for management to stabilize margins and improve revenue growth moving forward.

View full answer

Should I buy, sell or hold Ashoka Buildcon Ltd.?

23-May-2026

Why is Ashoka Buildcon Ltd. falling/rising?

24-May-2026

As of 24-May, Ashoka Buildcon Ltd. is facing a significant decline in its stock price, currently at 123.45, down -3.97%. The company has reported substantial drops in net sales and profit, contributing to a year-to-date decline of -26.76% and raising concerns about its financial stability.

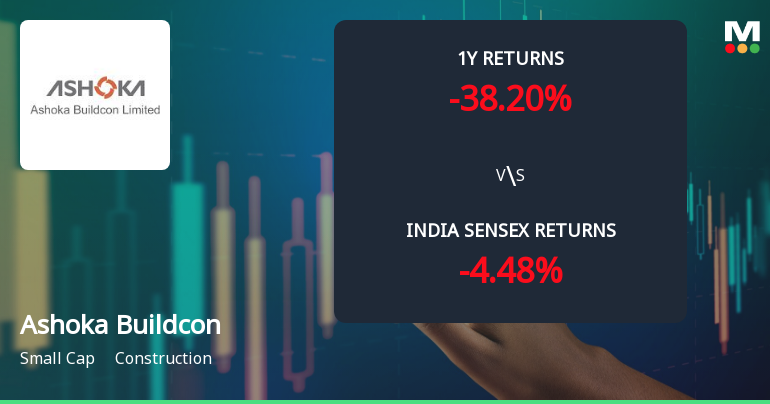
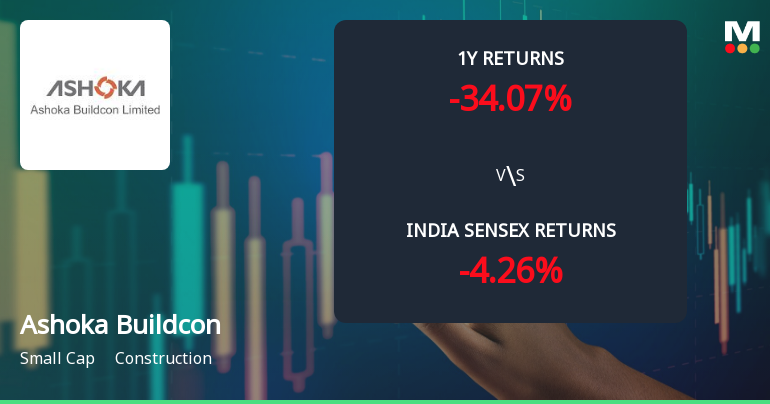
As of 24-May, Ashoka Buildcon Ltd. is experiencing a decline in its stock price, currently at 123.45, reflecting a change of -5.1 (-3.97%). The stock has underperformed the sector today by -2.44% and has fallen after two consecutive days of gains. It touched an intraday low of Rs 122.9, which is a decrease of -4.4%.<BR><BR>The stock's performance over various periods indicates a troubling trend. Over the past week, it has decreased by -3.67%, and in the last month, it has fallen by -10.51%. Year-to-date, the stock is down -26.76%, and over the past year, it has plummeted by -39.22%, significantly underperforming the market, which saw a decline of only -6.84%.<BR><BR>Several negative factors contribute to this decline. The company has reported a substantial fall in net sales of -27.47% and a significant drop in profit after tax (PAT) of -64.0%. These results have been consistent, with negative outcomes reported for the last three consecutive quarters. Additionally, the company's high debt-to-equity ratio of 2.74 times raises concerns about its long-term financial stability. <BR><BR>While there are some positive aspects, such as high management efficiency and institutional holdings, the overall financial health of Ashoka Buildcon Ltd. appears weak, leading to a lack of investor confidence and a resultant decline in stock price.

View full answer
iScoreScore
Click here to find our call on this stock
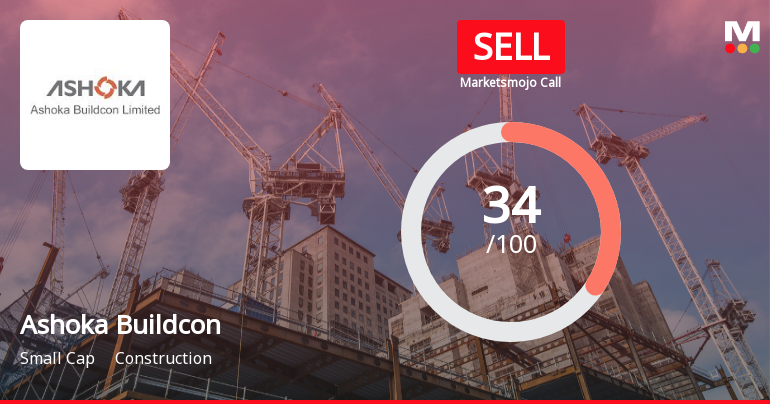
Strong Sell
Sell
Hold
Buy
Strong Buy

Dashboard

1

High Debt Company with a Debt to Equity ratio (avg) of 2.74 times

  • High Debt Company with a Debt to Equity ratio (avg) of 2.74 times
2

High Debt company with Weak Long Term Fundamental Strength

 
3

With a fall in Net Sales of -27.47%, the company declared Very Negative results in Mar 26

4

Underperformed the market in the last 1 year

stock-summaryMojo Parameters

Mojo Parameters

Loading Valuation Snapshot...

Stock DNA

stock-summary
Industry

Construction

stock-summary
Market cap

INR 3,503 Cr (Small Cap)

stock-summary
P/E

4.00

stock-summary
Industry P/E

34

stock-summary
Dividend Yield

0.00%

stock-summary
Debt Equity

0.15

stock-summary
Return on Equity

38.03%

stock-summary
Price to Book

0.82

Revenue and Profits:
Net Sales:
1,954 Cr
(Quarterly Results - Mar 2026)
Net Profit:
143 Cr
stock-summaryTotal Returns
Total Returns (Price + Dividend) stock-summary
Dividend Yield (0%)
TimePeriod
Price Return
Dividend Return
Total Return
3 Months
-9.44%
0%
-9.44%
6 Months
-29.77%
0%
-29.77%
1 Year
-40.91%
0%
-40.91%
2 Years
-31.45%
0%
-31.45%
3 Years
62.06%
0%
62.06%
4 Years
80.2%
0%
80.2%
5 Years
33.11%
0%
33.11%

Latest dividend: 0.8 per share ex-dividend date: Mar-27-2018

Risk Adjusted Returns v/s stock-summary
Returns Beta
Icon
Beta has not been calculated since enough price history is not available
stock-summaryNews & Corporate Actions

News

Announcements stock-summary

Ashoka Buildcon Limited - Analysts/Institutional Investor Meet/Con. Call Updates

28-Nov-2019 | Source : NSE

Ashoka Buildcon Limited has informed the Exchange regarding Analysts/Institutional Investor Meet/Con. Call Updates

Ashoka Buildcon Limited - Updates

18-Nov-2019 | Source : NSE

Ashoka Buildcon Limited has informed the Exchange regarding 'Lowest bidder for NHAI Project '.

Ashoka Buildcon Limited - Investor Presentation

15-Nov-2019 | Source : NSE

Ashoka Buildcon Limited has informed the Exchange regarding Investor Presentation

Corporate Actions stock-summary

stock-summary
BOARD MEETING

No Upcoming Board Meetings

stock-summary
DIVIDEND

Ashoka Buildcon Ltd. has declared 16% dividend, ex-date: 27 Mar 18

stock-summary
SPLITS

Ashoka Buildcon Ltd. has announced 5:10 stock split, ex-date: 03 Jul 13

stock-summary
BONUS

Ashoka Buildcon Ltd. has announced 1:1 bonus issue, ex-date: 12 Jul 18

stock-summary
RIGHTS

No Rights history available

stock-summaryKey Factors

Quality key factors stock-summary

Factor
Value
Sales Growth (5y)
8.54%
EBIT Growth (5y)
6.45%
EBIT to Interest (avg)
1.67
Debt to EBITDA (avg)
2.26
Net Debt to Equity (avg)
0.15
Sales to Capital Employed (avg)
1.26
Tax Ratio
17.77%
Dividend Payout Ratio
0
Pledged Shares
0
Institutional Holding
20.29%
ROCE (avg)
32.80%
ROE (avg)
34.53%

Valuation key factors

Factor
Value
P/E Ratio
4
Industry P/E
34
Price to Book Value
0.82
EV to EBIT
2.37
EV to EBITDA
2.17
EV to Capital Employed
0.85
EV to Sales
0.54
PEG Ratio
NA
Dividend Yield
NA
ROCE (Latest)
50.23%
ROE (Latest)
38.03%

Technicals key factors

Indicator
Weekly
Monthly
MACD
Mildly Bullish
Bearish
RSI
No Signal
No Signal
Bollinger Bands
Bearish
Bearish
Moving Averages
Bearish (Daily)
KST
Mildly Bullish
Bearish
Dow Theory
Mildly Bearish
Mildly Bullish
OBV
Mildly Bearish
No Trend
stock-summary Technical Indicator Scale: Bearish, Mildly Bearish, Sideways, Mildly Bullish, Bullish  Turned 
stock-summaryShareholding
Shareholding Snapshot : Mar 2026stock-summary
Shareholding Compare (%holding) stock-summary
Majority shareholders

Promoters

Pledged Promoter Holdings

None

Mutual Funds

Held by 16 Schemes (14.37%)

FIIs

Held by 78 FIIs (5.9%)

Promoter with highest holding

Shobha Parakh (13.55%)

Highest Public shareholder

Hdfc Trustee Company Ltd. A/c Hdfc Balanced Advantage Fund (5.98%)

Individual Investors Holdings

22.13%

stock-summaryFinancial
[
  {
    "link": "quarterly",
    "btn_text": "All Quarterly Results",
    "header": "Quarterly Results Snapshot (Consolidated) - Mar'26 - YoY",
    "rhs": [
      {
        "prefix": "Net Sales ",
        "suffix": "YoY Growth in quarter ended Mar 2026 is -27.47% vs -11.71% in Mar 2025",
        "dir": -1
      },
      {
        "prefix": "Consolidated Net Profit ",
        "suffix": "YoY Growth in quarter ended Mar 2026 is -66.88% vs 73.15% in Mar 2025",
        "dir": -1
      }
    ],
    "table": {
      "header": [
        "Mar'26",
        "Mar'25",
        "Change(%)"
      ],
      "body": [
        {
          "field": "Net Sales",
          "val1": "1,954.30",
          "val2": "2,694.42",
          "chgp": "-27.47%",
          "chgp_class": "negative"
        },
        {
          "field": "Operating Profit (PBDIT) excl Other Income",
          "val1": "263.45",
          "val2": "777.20",
          "chgp": "-66.10%",
          "chgp_class": "negative"
        },
        {
          "field": "Interest",
          "val1": "82.42",
          "val2": "317.68",
          "chgp": "-74.06%",
          "chgp_class": "positive"
        },
        {
          "field": "Exceptional Items",
          "val1": "-13.34",
          "val2": "0.00",
          "chgp": "",
          "chgp_class": "neutral"
        },
        {
          "field": "Consolidate Net Profit",
          "val1": "143.14",
          "val2": "432.23",
          "chgp": "-66.88%",
          "chgp_class": "negative"
        },
        {
          "field": "Operating Profit Margin (Excl OI)",
          "val1": "13.48%",
          "val2": "28.84%",
          "chgp": "-15.36%",
          "chgp_class": "negative"
        }
      ]
    }
  },
  {
    "link": "half-yearly",
    "btn_text": "All Half Yearly Results",
    "header": "Half Yearly Results Snapshot (Consolidated) - Sep'25",
    "rhs": [
      {
        "prefix": "Net Sales ",
        "suffix": " Growth in half year ended Sep 2025 is -24.55% vs 21.15% in Sep 2024",
        "dir": -1
      },
      {
        "prefix": "Consolidated Net Profit ",
        "suffix": " Growth in half year ended Sep 2025 is -51.35% vs 237.39% in Sep 2024",
        "dir": -1
      }
    ],
    "table": {
      "header": [
        "Sep'25",
        "Sep'24",
        "Change(%)"
      ],
      "body": [
        {
          "field": "Net Sales",
          "val1": "3,738.25",
          "val2": "4,954.32",
          "chgp": "-24.55%",
          "chgp_class": "negative"
        },
        {
          "field": "Operating Profit (PBDIT) excl Other Income",
          "val1": "1,183.60",
          "val2": "1,504.04",
          "chgp": "-21.31%",
          "chgp_class": "negative"
        },
        {
          "field": "Interest",
          "val1": "629.31",
          "val2": "614.92",
          "chgp": "2.34%",
          "chgp_class": "negative"
        },
        {
          "field": "Exceptional Items",
          "val1": "-219.29",
          "val2": "0.00",
          "chgp": "",
          "chgp_class": "neutral"
        },
        {
          "field": "Consolidate Net Profit",
          "val1": "295.46",
          "val2": "607.37",
          "chgp": "-51.35%",
          "chgp_class": "negative"
        },
        {
          "field": "Operating Profit Margin (Excl OI)",
          "val1": "31.66%",
          "val2": "30.36%",
          "chgp": "1.30%",
          "chgp_class": "positive"
        }
      ]
    }
  },
  {
    "link": "nine-monthly",
    "btn_text": "All Nine Monthly Results",
    "header": "Nine Monthly Results Snapshot (Consolidated) - Dec'25",
    "rhs": [
      {
        "prefix": "Net Sales ",
        "suffix": "YoY Growth in nine months ended Dec 2025 is -24.20% vs 8.83% in Dec 2024",
        "dir": -1
      },
      {
        "prefix": "Consolidated Net Profit ",
        "suffix": "YoY Growth in nine months ended Dec 2025 is 90.74% vs 356.77% in Dec 2024",
        "dir": -1
      }
    ],
    "table": {
      "header": [
        "Dec'25",
        "Dec'24",
        "Change(%)"
      ],
      "body": [
        {
          "field": "Net Sales",
          "val1": "5,565.58",
          "val2": "7,342.21",
          "chgp": "-24.20%",
          "chgp_class": "negative"
        },
        {
          "field": "Operating Profit (PBDIT) excl Other Income",
          "val1": "1,618.88",
          "val2": "2,142.91",
          "chgp": "-24.45%",
          "chgp_class": "negative"
        },
        {
          "field": "Interest",
          "val1": "829.53",
          "val2": "927.64",
          "chgp": "-10.58%",
          "chgp_class": "positive"
        },
        {
          "field": "Exceptional Items",
          "val1": "2,157.01",
          "val2": "0.00",
          "chgp": "",
          "chgp_class": "neutral"
        },
        {
          "field": "Consolidate Net Profit",
          "val1": "2,406.87",
          "val2": "1,261.88",
          "chgp": "90.74%",
          "chgp_class": "positive"
        },
        {
          "field": "Operating Profit Margin (Excl OI)",
          "val1": "29.09%",
          "val2": "29.19%",
          "chgp": "-0.10%",
          "chgp_class": "negative"
        }
      ]
    }
  },
  {
    "link": "annual",
    "btn_text": "All Annual Results",
    "header": "Annual Results Snapshot (Consolidated) - Mar'26",
    "rhs": [
      {
        "prefix": "Net Sales ",
        "suffix": "YoY Growth in year ended Mar 2026 is -25.08% vs 2.43% in Mar 2025",
        "dir": -1
      },
      {
        "prefix": "Consolidated Net Profit ",
        "suffix": "YoY Growth in year ended Mar 2026 is 50.52% vs 236.75% in Mar 2025",
        "dir": -1
      }
    ],
    "table": {
      "header": [
        "Mar'26",
        "Mar'25",
        "Change(%)"
      ],
      "body": [
        {
          "field": "Net Sales",
          "val1": "7,519.88",
          "val2": "10,036.63",
          "chgp": "-25.08%",
          "chgp_class": "negative"
        },
        {
          "field": "Operating Profit (PBDIT) excl Other Income",
          "val1": "1,882.34",
          "val2": "2,920.10",
          "chgp": "-35.54%",
          "chgp_class": "negative"
        },
        {
          "field": "Interest",
          "val1": "911.95",
          "val2": "1,245.31",
          "chgp": "-26.77%",
          "chgp_class": "positive"
        },
        {
          "field": "Exceptional Items",
          "val1": "2,143.67",
          "val2": "0.00",
          "chgp": "",
          "chgp_class": "neutral"
        },
        {
          "field": "Consolidate Net Profit",
          "val1": "2,550.01",
          "val2": "1,694.10",
          "chgp": "50.52%",
          "chgp_class": "positive"
        },
        {
          "field": "Operating Profit Margin (Excl OI)",
          "val1": "25.03%",
          "val2": "29.09%",
          "chgp": "-4.06%",
          "chgp_class": "negative"
        }
      ]
    }
  }
]

Quarterly Results Snapshot (Consolidated) - Mar'26 - YoYstock-summary

Mar'26
Mar'25
Change(%)
Net Sales
1,954.30
2,694.42
-27.47%
Operating Profit (PBDIT) excl Other Income
263.45
777.20
-66.10%
Interest
82.42
317.68
-74.06%
Exceptional Items
-13.34
0.00
Consolidate Net Profit
143.14
432.23
-66.88%
Operating Profit Margin (Excl OI)
13.48%
28.84%
-15.36%
Values in Rs Cr.
Direction Arrows
Net Sales

YoY Growth in quarter ended Mar 2026 is -27.47% vs -11.71% in Mar 2025

Direction Arrows
Consolidated Net Profit

YoY Growth in quarter ended Mar 2026 is -66.88% vs 73.15% in Mar 2025

Half Yearly Results Snapshot (Consolidated) - Sep'25stock-summary

Sep'25
Sep'24
Change(%)
Net Sales
3,738.25
4,954.32
-24.55%
Operating Profit (PBDIT) excl Other Income
1,183.60
1,504.04
-21.31%
Interest
629.31
614.92
2.34%
Exceptional Items
-219.29
0.00
Consolidate Net Profit
295.46
607.37
-51.35%
Operating Profit Margin (Excl OI)
31.66%
30.36%
1.30%
Values in Rs Cr.
Direction Arrows
Net Sales

Growth in half year ended Sep 2025 is -24.55% vs 21.15% in Sep 2024

Direction Arrows
Consolidated Net Profit

Growth in half year ended Sep 2025 is -51.35% vs 237.39% in Sep 2024

Nine Monthly Results Snapshot (Consolidated) - Dec'25stock-summary

Dec'25
Dec'24
Change(%)
Net Sales
5,565.58
7,342.21
-24.20%
Operating Profit (PBDIT) excl Other Income
1,618.88
2,142.91
-24.45%
Interest
829.53
927.64
-10.58%
Exceptional Items
2,157.01
0.00
Consolidate Net Profit
2,406.87
1,261.88
90.74%
Operating Profit Margin (Excl OI)
29.09%
29.19%
-0.10%
Values in Rs Cr.
Direction Arrows
Net Sales

YoY Growth in nine months ended Dec 2025 is -24.20% vs 8.83% in Dec 2024

Direction Arrows
Consolidated Net Profit

YoY Growth in nine months ended Dec 2025 is 90.74% vs 356.77% in Dec 2024

Annual Results Snapshot (Consolidated) - Mar'26stock-summary

Mar'26
Mar'25
Change(%)
Net Sales
7,519.88
10,036.63
-25.08%
Operating Profit (PBDIT) excl Other Income
1,882.34
2,920.10
-35.54%
Interest
911.95
1,245.31
-26.77%
Exceptional Items
2,143.67
0.00
Consolidate Net Profit
2,550.01
1,694.10
50.52%
Operating Profit Margin (Excl OI)
25.03%
29.09%
-4.06%
Values in Rs Cr.
Direction Arrows
Net Sales

YoY Growth in year ended Mar 2026 is -25.08% vs 2.43% in Mar 2025

Direction Arrows
Consolidated Net Profit

YoY Growth in year ended Mar 2026 is 50.52% vs 236.75% in Mar 2025

stock-summaryCompany CV
About Ashoka Buildcon Ltd. stock-summary
stock-summary
Ashoka Buildcon Ltd.
Small Cap
Construction
Ashoka Buildcon Ltd. was incorporated in May, 1993. The Company is engaged in the business of construction of infrastructure facilities on Engineering, Procurement and Construction Basis (EPC) and Built, Operate and Transfer (BOT) Basis and Sale of Ready Mix Concrete. The company has promoted Special Purpose Vehicles (SPVs) for some of its projects, wherein 'Toll Collection Rights' are received in exchange of the construction cost.
Company Coordinates stock-summary
Company Details
Survey No 861 Ashoka House, Ashok Marg Vadala Nashik Maharashtra : 422011
stock-summary
Tel: 91-253-3011705
stock-summary
investors@ashokabuildcon.com
Registrar Details
Link Intime India Pvt Ltd, C-13 Pannalal Silk Compound, L B S Marg, Bhandup , Mumbai